Fast Visual Guide to process routine datasets


Fast Visual Guide to process routine datasets |
|
|
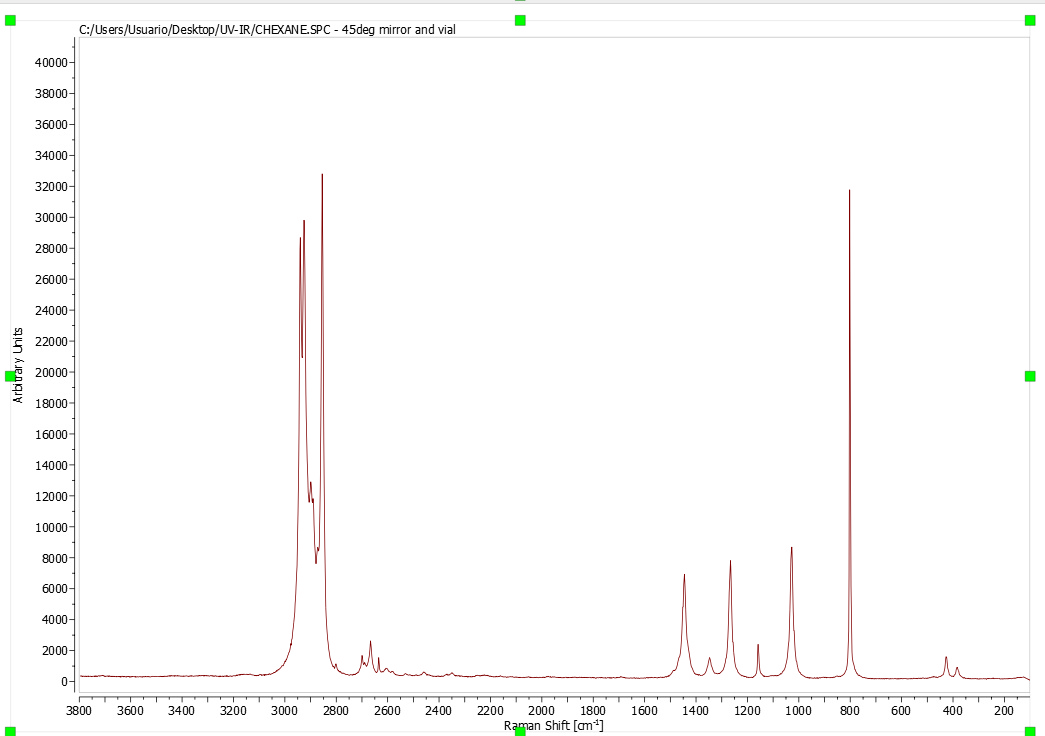
Go through the following procedure to process a routine ElViS spectrum (you can download the examples from here): 1. Drag and drop the file into Mnova to get your spectrum fully processed. (You can also follow the menu 'File/Open')
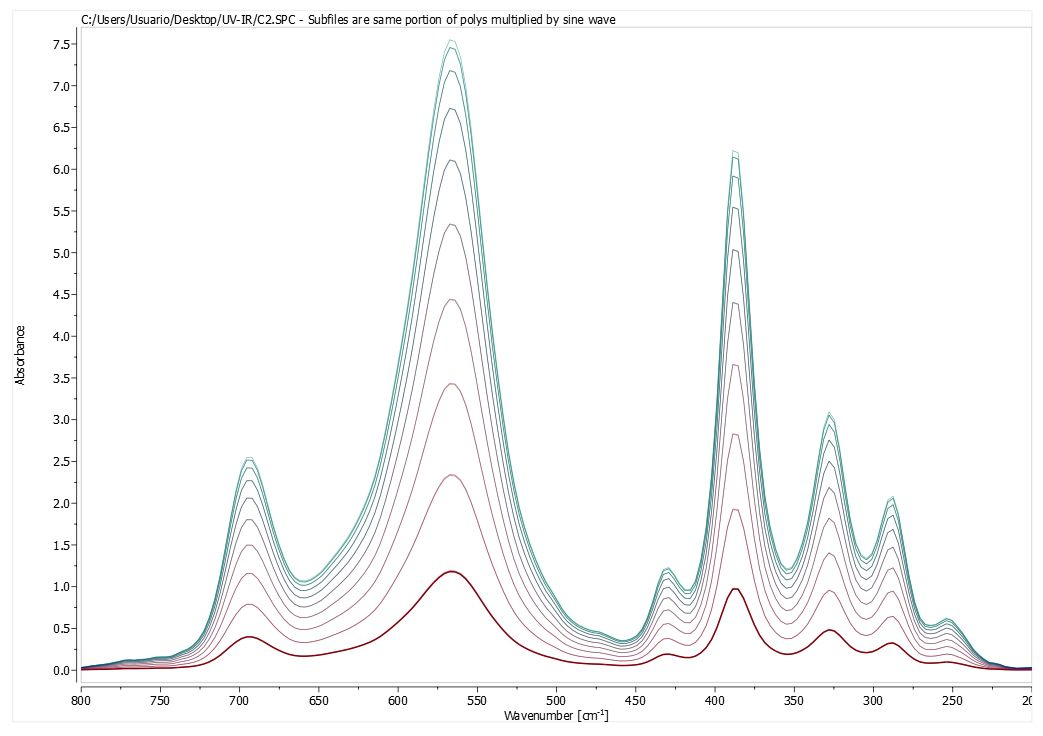
If you have several datasets, you can load of all them in your Mnova document, to generate a stacked plot (after having highlighted them on your Page Navigator and followed the menu 'Stack/Stack Items') You can also load spectra acquired in arrayed mode:
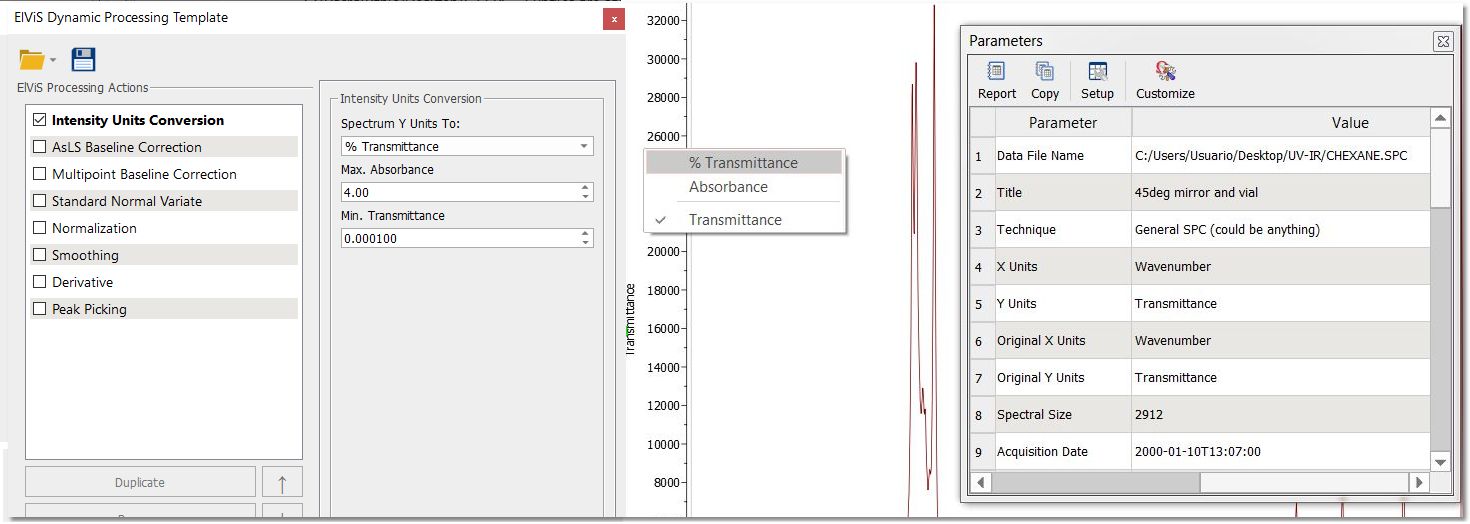
2. You can convert the spectral X-scale into another units by right clicking on the scale and choosing another compatible unit type from the drop-down list. Similar operation is available for the Y-units (intensity). The intensity units can also be converted from the Processing Template. If the units were not recognized by the import function or were absent in the source data format, they appear as ‘Arbitrary units’ in spectra. You can reset ‘Arbitrary units’ (as well as any other wrong original units) from the 'Parameters Table' (which can be displayed by following the menu 'View/Parameters') Double click to ‘Original X units’ or ‘Original Y units’ field values and choose an appropriate unit type from the drop-down list of available unit types. (Note, this operation is generally discouraged, because it can lead to data visualization and analysis mistakes! Avoid its application unless you are confident).
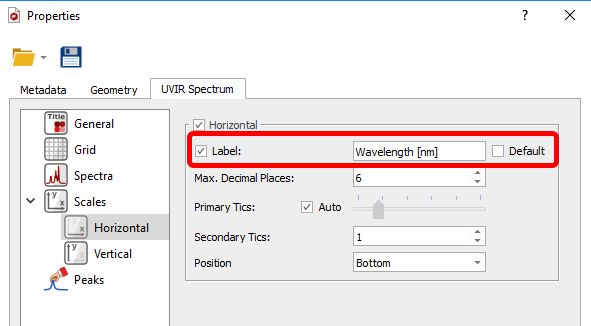
Besides, independently on the current and original X- and Y-units, you can define any custom labels on the respective axis using the Properties dialogue:
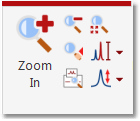
3. You can zoom in by using the applicable button from the View ribbon (or the shortcut: Z). With active ‘Zoom In’ mode press Z to switch between horizontal, vertical and rectangular zoom. From that ribbon, you will find different zoom modes and a tool to create expansions (shortcut: E):
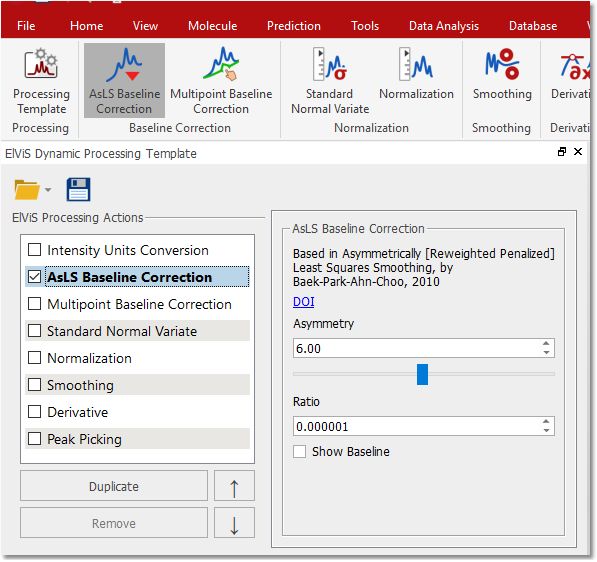
4. Click on the 'AsLS Baseline Correction' icon to correct the baseline of your spectrum automatically. The Dynamic Processing Template panel will appear to allow you to change the ALS baseline correction parameters:
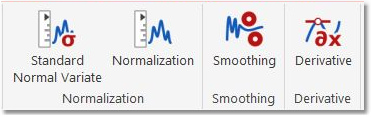
A manual multipoint baseline correction mode can also be selected, when fine tuning of the corrected baseline is necessary. 5. If spectrum processing is needed, to improve the data to subsequent analysis,you can apply a normalization, smoothing or derivative from the main toolbar (or from the 'Dynamic Processing Template'):
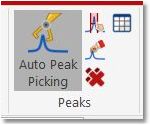
6. Clicking on the Automatic Peak Picking button will label the peak in a spectrum on screen in accordance with the options.
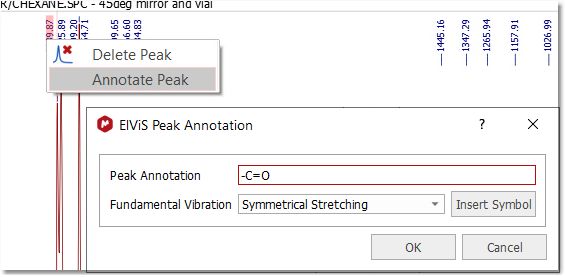
Manual Peak Picking can also be applied by selecting the 'Manual Threshold mode' and clicking and dragging over the desired region of interest to label the peaks within it. The 'Peak by peak' mode also allows setting or removing a label in an arbitrary position one by one to select unresolved peaks. Right clicking on any peak label will allow you to annotate it:
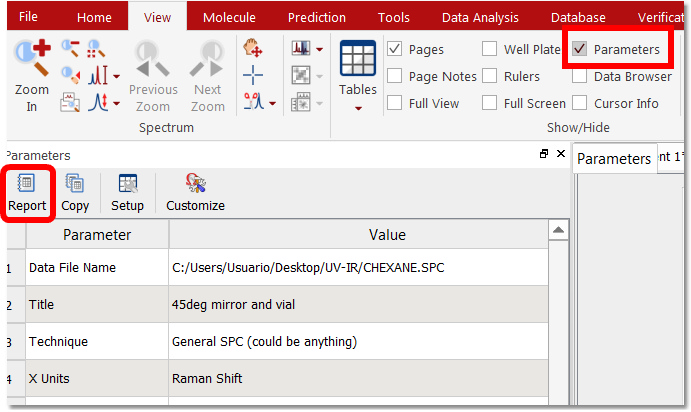
7. To paste the Parameters Table on the spectral window, just follow the menu: 'View/Parameters' and click on the 'Report' icon.
8. Finally, you will be able to save, print or export the document to PDF by clicking on a respective icon under the 'file ribbon' (or on the toolbar):
You can also export your datasets as ASCII (*.txt or *.csv), JCAMP-DX or any image format by selecting 'Save As'. |