Peak Picking


Peak Picking |
|
|
Mnova implements a series of peak picking algorithms for 1D and 2D. These algorithms can be accessed via the menu item 'Analysis/Peak Picking'.
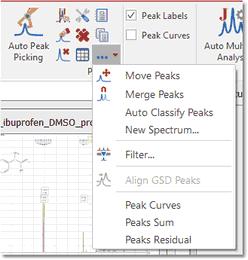
From here, you will be allowed you to use Automatic Peak Picking, Manual Peak Picking (Manual Threshold), Peak by Peak Peak Picking, Move Peaks, Auto Classify Peaks (it will classify peaks as compound, impurity, solvent, artifact, etc by using the molecular structure of the document), create a new synthesized spectrum, to show or not show peaks on screen, to delete all peaks or delete peaks one by one, to set Peak Picking Options and to report the peak list, etc.
Automatic Peak Picking
The Automatic Peak Picking option can be launched by simply clicking on the 'Peak Picking' icon on the toolbar. This algorithm will pick all the peaks in the spectrum, and, by default, show them on screen with automatic recognition of the solvent lines. This algorithm can be applied indistinctively to 1D and 2D spectra.
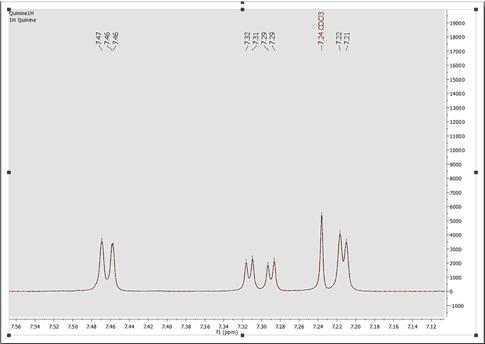
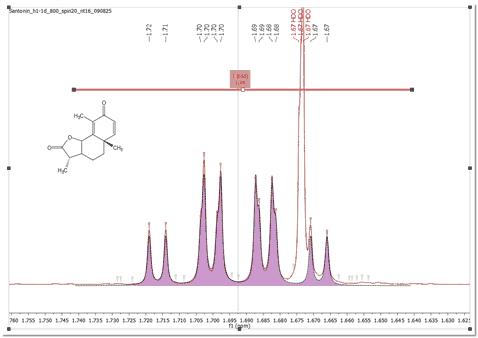
This is a major change to Mnova NMR functionality. The default automatic Peak Picking algorithm is now based on GSD, rendering enhanced resolution, identification of overlapped peaks and also including autodetection of solvent and impurities (this algorithm is slower than the Standard, so if you are not interested in the deconvolution, you may prefer to use the Standard algorithm. See options below)
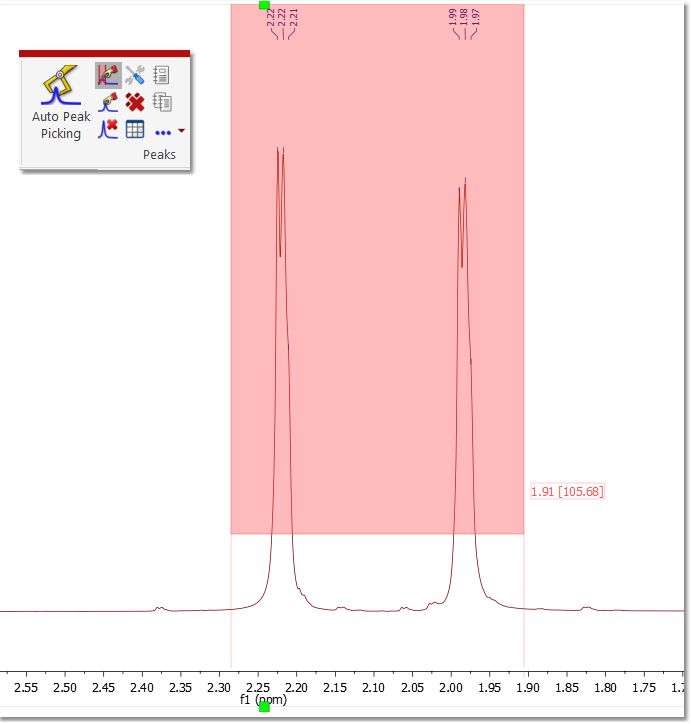
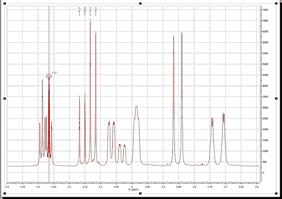
You can see above an example of the autoediting capabilities in the new algorithm, which automatically identifies solvents (as well as impurities, reference peaks, etc). You can see below another example of the enhanced resolution achieved by the new Peak picking algorithm, now capable of identifying shoulders on large peaks as smaller peaks and of labelling and include them in multiplet analysis.
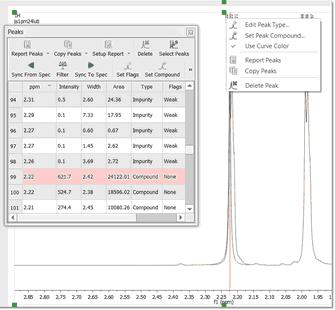
Peak curves are now active objects which can be interacted with, and three-way highlighting of peaks table, peak labels and the peak themselves has been implemented. For example, double clicking on any peak label will display the 'Peaks Table', hovering the mouse over the peak label (or on any table) will highlight the peak in the spectrum and allow the user to interact directly with that peak. Clicking on any peak of the spectrum will automatically scroll up/down the table to the position of currently highlighted peak in the spectrum. Right clicking on any peak, will allow you to change the 'Peak Type' from the 'Peaks context' menu (and to set peak compound, use curve color, report, copy and delete peaks).
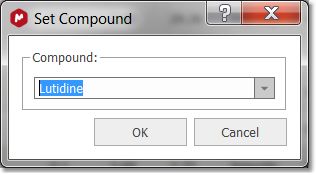
If your document contains more than one compounds, you will be able to select the applicable compound for each peak by right clicking on the peak label (or by selecting the peak(s) from the Peaks Table) and selecting 'Set Peak Compound':
Manual Threshold (shortcut: k) The Manual Peak Picking allows the user to set an area of the spectrum where the software will carry out the Peak Picking, by simply left clicking and dragging the mouse over the area.
Peak by Peak (shortcut: Ctrl+k or Cmd+k in Mac)
The Peak by Peak option will allow you to hover the mouse over specific peaks of interest and to only select those for the peak picking output, by just left clicking on each one at a time. The procedure is very simple: just point to the peak you want to pick so that it is highlighted and then left click on the mouse.
Note that, by default, Mnova will find the peak top by using parabolic interpolation. To pick a peak at an arbitrary position (e.g. not at a local extreme), press <Shift> and click.
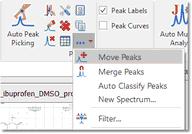
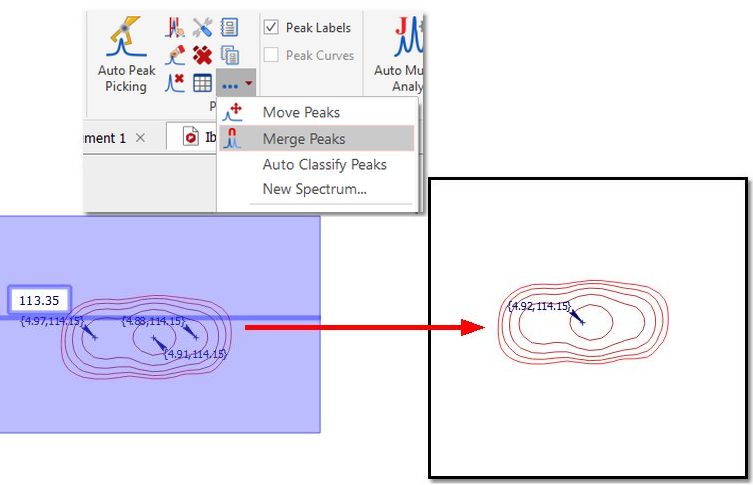
Mnova also allows the user to move a peak label to a new location, by using the 'Move Peaks' tool under the Peak Picking scroll down menu.
Note: When a peak is moved its Annotation information remains unchanged, although other info such as peak widths and intensities are updated. Merge Peaks Use this mode to merge more than one peak labels into a new one:
Once you have finished with the 'Peak Picking', select the ‘Report’ option in the Peak Picking menu. Select 'Copy Peaks' to copy the report to the clipboard. Choose the peak report template for the 'Peak List' just by selecting 'Setup' in the 'Report Special' scroll down menu of the 'Peaks Table'.
The peak list of a spectrum can be exported via File/Save As and selecting "Script: NMR 1D Peak List". It includes values of ppm and intensity for each peak. Follow the menu 'File/Save As/Script: NMR Peaks Table' to export the peaks in a table (only the fields set as 'Visible' in Setup Table get exported). |