Peaks Table and Reports


Peaks Table and Reports |
|
|
Peak Table: The user will obtain the peak table by following the menu 'View/Tables/Peaks'. Clicking on any peak of the spectrum will automatically scroll up/down the table to the position of currently highlighted peak in the spectrum,
Please note that hovering the mouse over the peak label will highlight the applicable peak shape in the spectrum. The same effect you will obtain if you hover the applicable cell in the Peaks Table. Double clicking on a row in Peaks table will zoom in that peak in the spectrum. Move the peaks labels up and down just by clicking and dragging them.
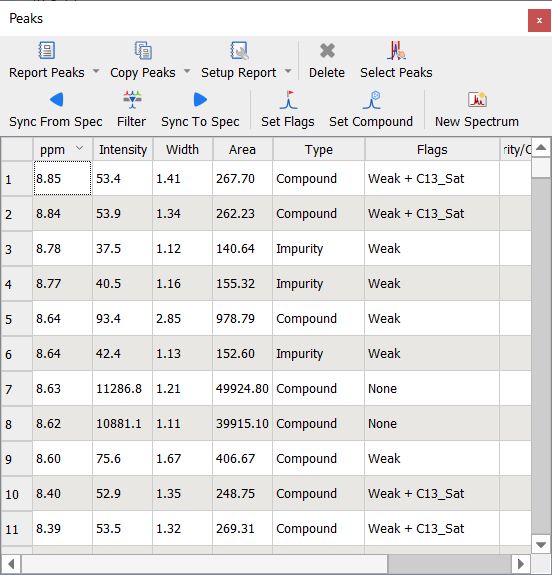
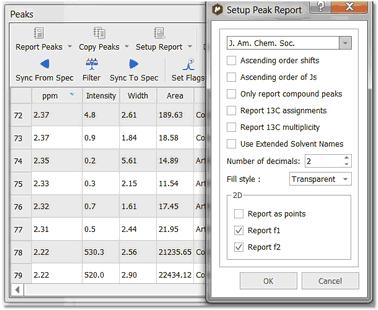
The Peaks table displays the list of peaks, including the following information: chemical shift in ppm and Hz, Intensity (height), Width (in Hz, at half maximum of the peak -FWHM), Type (compound, solvent, impurity, etc), Flags, Multiplicity (for the carbons) and 'Annotations'. The user can report the Peak table directly on the spectrum by clicking on the 'Report Table' icon under the 'Report Peaks' scroll down menu . To delete an undesired peak, click on the 'Delete' icon of the Peak List, or select 'Delete Manually' on the Peak Picking scroll bar icon:
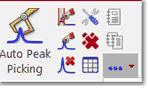
By default, peak frequencies are listed directly on the spectrum but they can also be accessed via the Peak Picking table and also as a 'Peak List' by clicking on the 'Report Peaks' icon. The user will be able to select the 'Peak Report' Template between several journal formats by selecting 'Setup Report' in the 'Peaks table'.
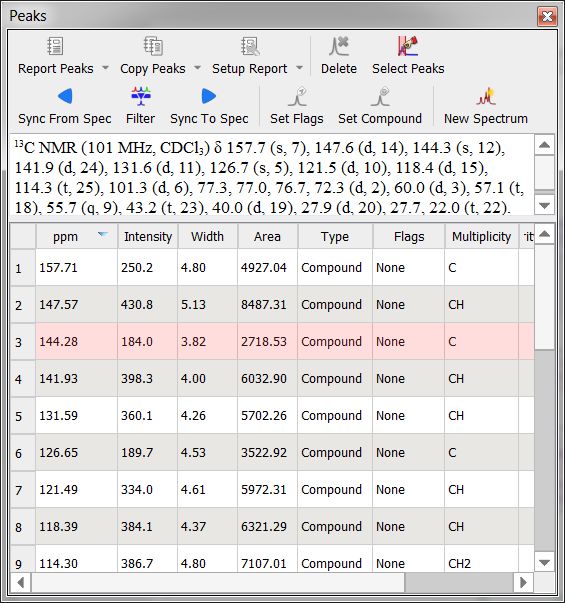
From here you can select the order of the report (ascending or descending), the option to only report the compounds peaks, to report the 13C assignment and to select the number of decimals. For 2D experiments, you will have the choice to report a list of F1, F2 peaks or both. This option will be remembered when creating a reporting template. After making assignments to the 13C peaks the multiplicity gets automatically filled in Peaks table. This multiplicity information can be included in the Peaks Report by selecting it in Setup Report.
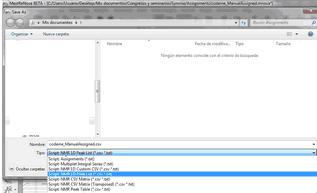
The user will be able to copy the 'Peak List' report to the clipboard by selecting 'Copy Peaks' on the 'Peaks Table'. The peak list can also be exported as an ASCII file by following the menu 'File/Save as' and selecting Script: NMR 1D Peak List (*.csv, *.txt):
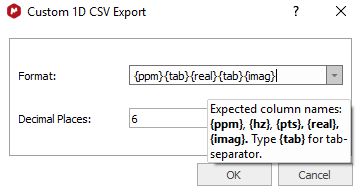
You can export NMR spectra via 'File/Save As/NMR Custom CSV File' with options to export PPM+Re+Im, Hz+Re, PPM+Re or Hz+Re+Im, either from right to left or from left to right.
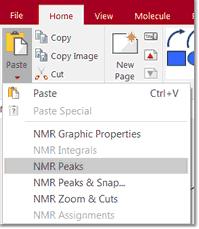
Follow the menu 'File/Save As/Script: NMR Peaks Table' to export the peaks in a table (only the fields set as 'Visible' in 'Setup Table' will be exported). To copy&paste the peaks from one spectrum to another, just press 'Ctrl/Cmd+C' in the original spectrum and then follow the menu 'Home/Paste Properties/Paste NMR Peaks in the other spectrum (or spectra, if you have previously selected them in the page navigator):
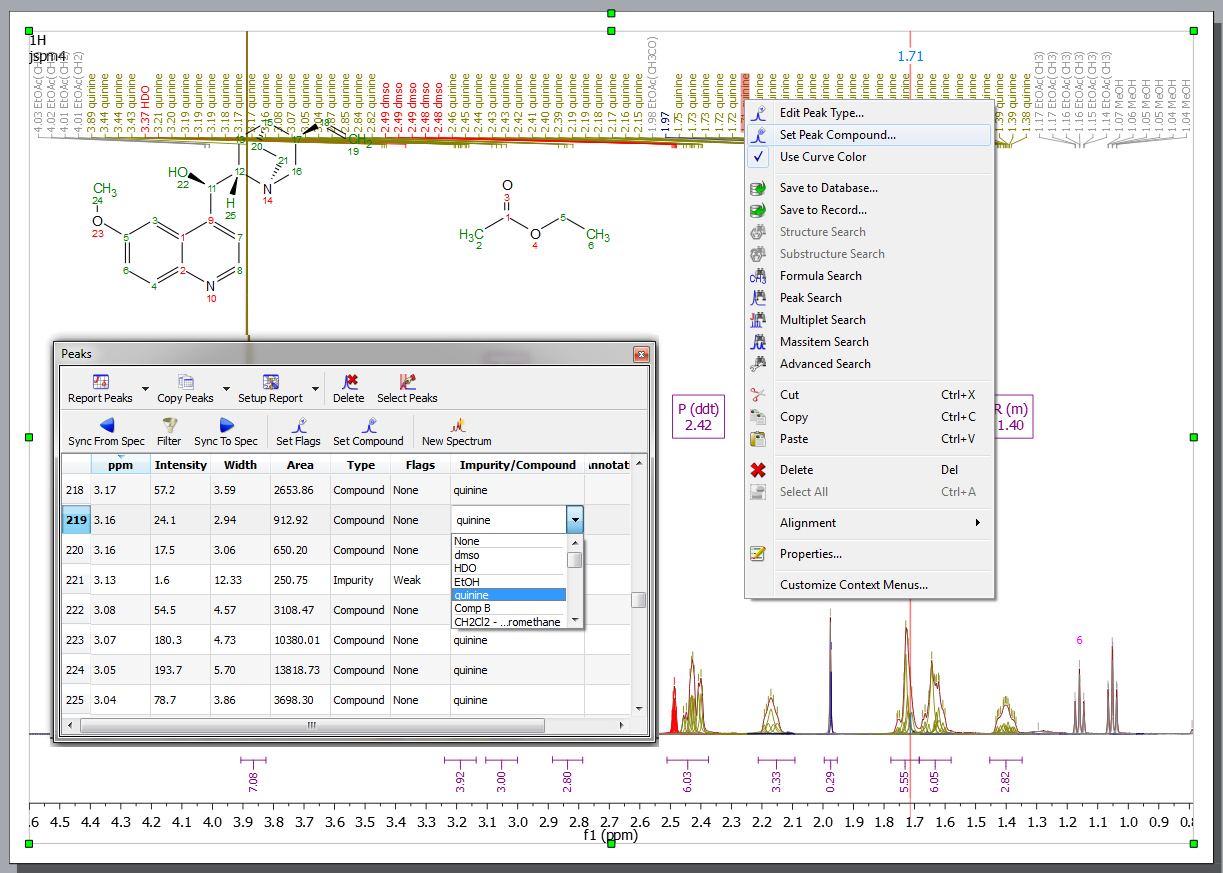
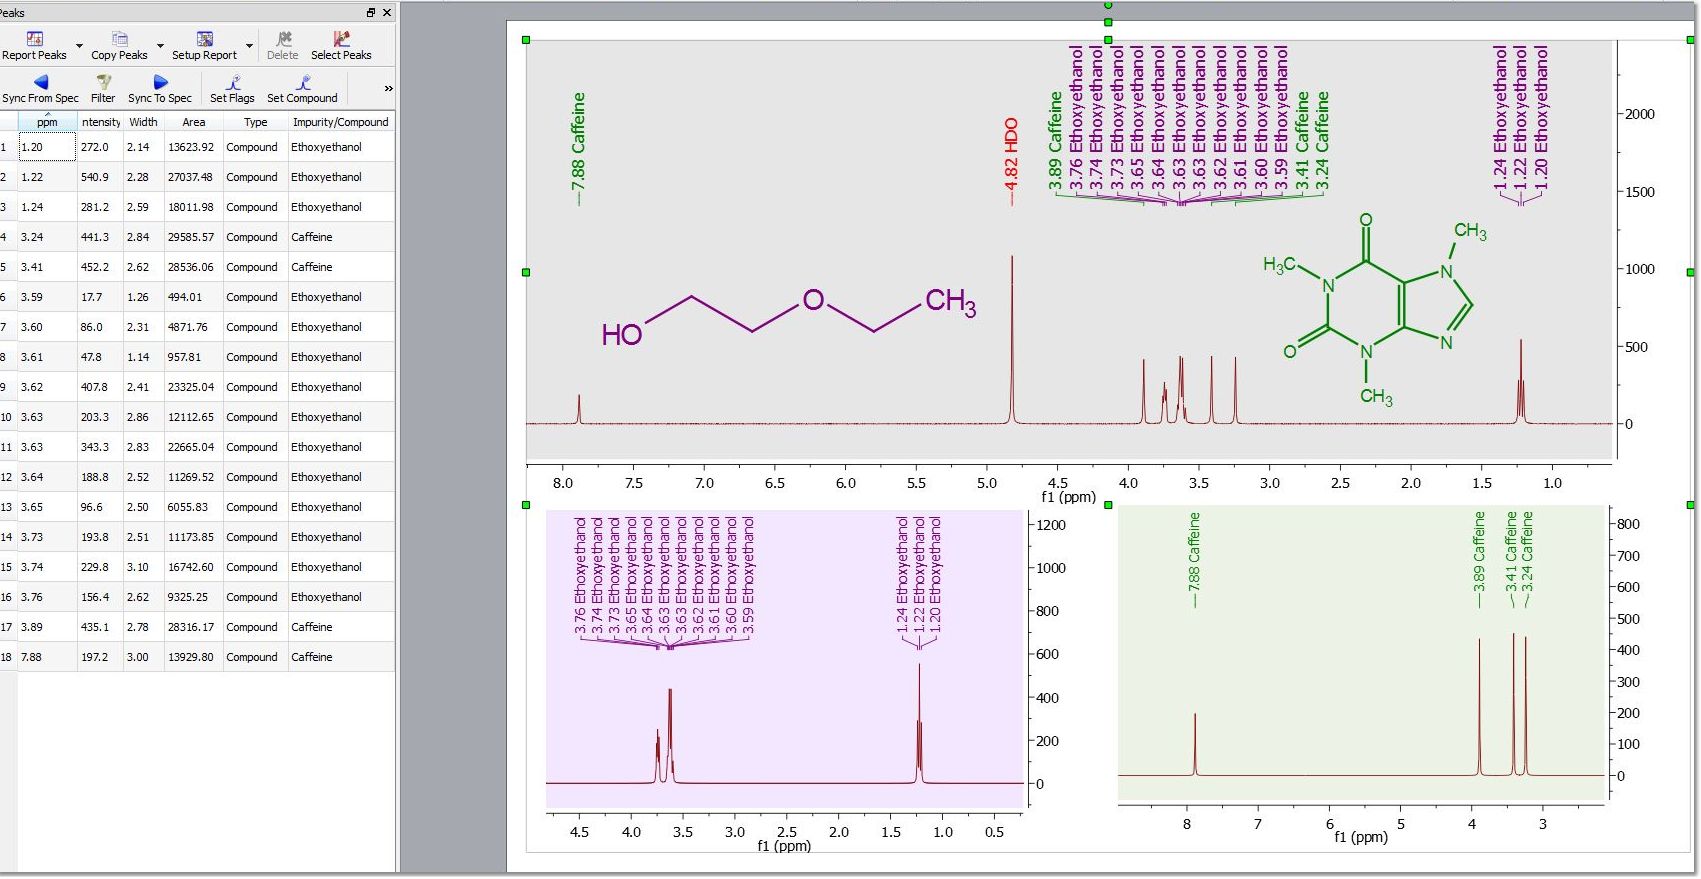
If your document contains more than one compounds, you will be able to select the compound for each peak from the Peaks Table (by clicking on the 'Set Compound' button or by double clicking on the 'Impurity/Compound' cell). The same effect will be obtained by right clicking on the Peak label and selecting ‘Set Peak Compound’:
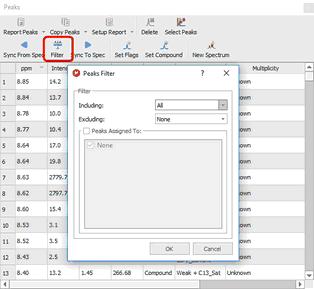
You can apply some filters to show for example only Compounds Peaks. If the spectrum contains peaks belonging to more than one compound, you can show only the peaks assigned to one of them (by using the 'Filter' button):
You can synchronize the type of the peaks in the table (i.e: only Compounds peaks) with the peaks showed in the spectrum (by using the button 'Sync from Item') or viceversa, synchronize the spectrum peaks with the peaks showed in the table ('Sync to Item' button).
The 'New spectrum' button
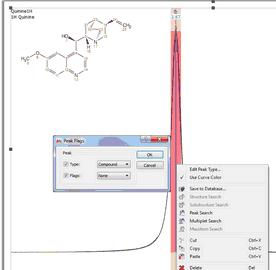
Select 'Auto Classify Peaks' in the Peak Picking scroll down menu to edit automatically the Type and Flags of each signal: You can also manually edit the 'Type' and the 'Flags' table just by double clicking on the applicable cell. Right click on any peak and select 'Edit Peak Type' to change the Peak type:
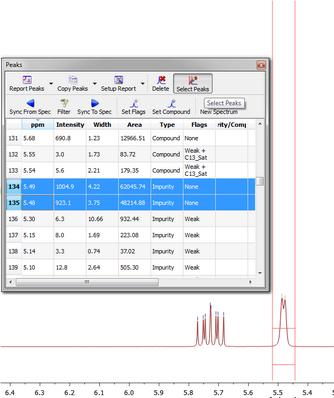
The user will be able to highlight in the table any desired peak just by clicking on the 'Select Peaks' button and then selecting the peaks in the spectrum (by clicking and dragging); then the user will be able to modified their flags (or Type) by clicking on the 'Set Flags' button. In the example below, we have changed the type of two peaks (from compound to impurity):
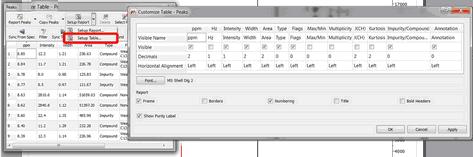
You can customize the appearance of the table by clicking on the 'Setup Table' button:
Purity (as a ratio of Compounds Vs (Impurity+Artifacts) peaks) can be displayed in Peaks table by selecting the checkbox "Show Purity Label" in Setup Table (disabled by default). To export the peaks in a table, follow the menu 'File/Save As/Script: NMR Peaks Table'; (only the fields set as 'Visible' in Setup Table get exported). See also Tables.
Customizing Peak Reports
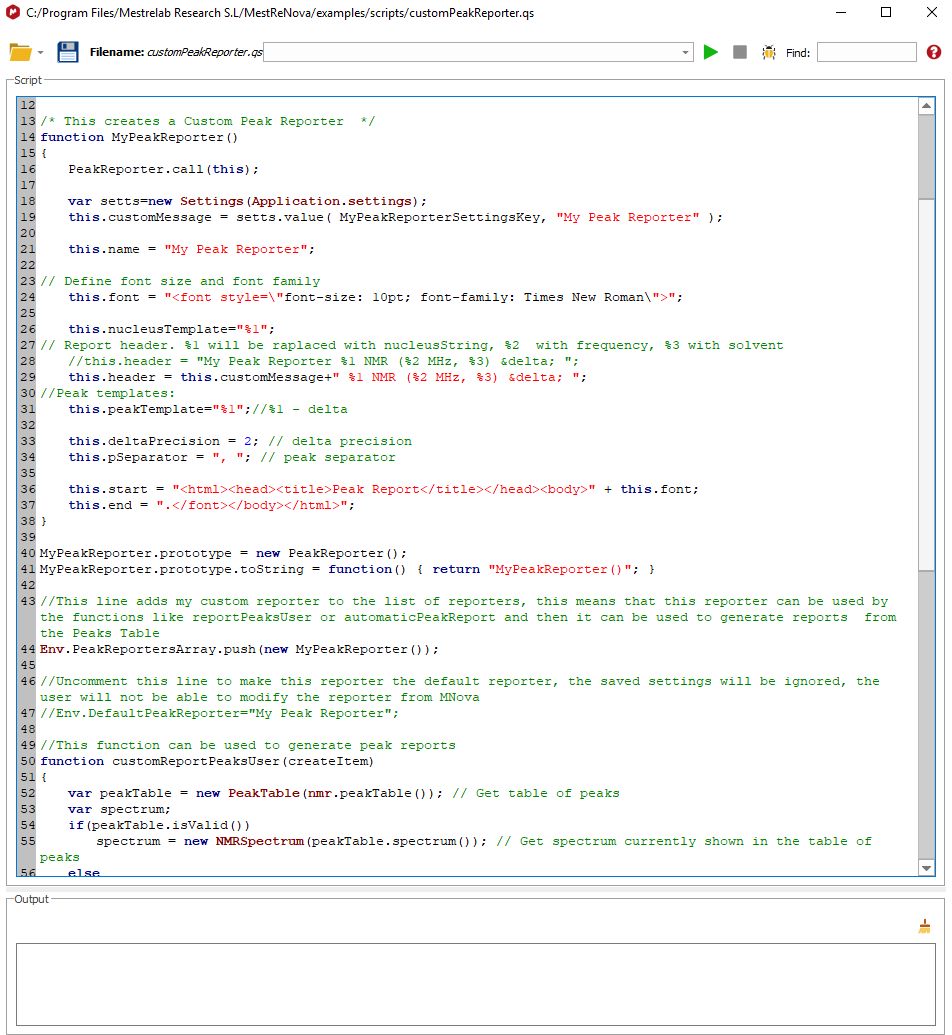
You can add additional report templates by creating new scripts. You will find an example of a script (customPeakReporter.qs) with a different 'Peak Report Template' in the 'examples/scripts' folder of Mnova. To see how to customize this script, take a look at the 'Multiplet Analysis' chapter. The concept will be the same.
For 2D. you can modify the 'PeakReporter.qs' script (which is located in the scripts folder of Mnova) by just changing the false with true in this line:
//Report f1 value in 2D spectrum this.reportf1In2D=false;
with: this.reportf1In2D=true;
and you will get a report like this:
NMR (400 MHz, CDCl3) δ (8.62 147.34), (7.97 131.35), (7.94 131.37), (7.46 118.14), (7.32 121.23), (7.28 121.24), (7.21 101.03), (5.48 71.99), (4.91 114.03), (3.87 55.34), (3.11 59.66), (3.05 56.77), (2.65 56.82), (2.62 42.87), (1.78 27.53), (1.54 21.65).
See also: |