Tables


Tables |
|
|
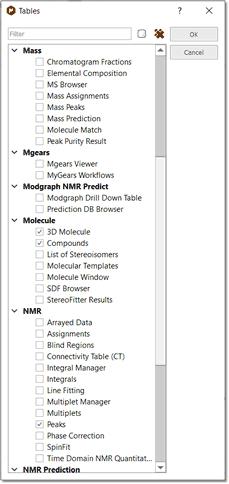
Mnova groups all spectra relevant information into the so-called Tables window, available from the View menu or by right clicking on any toolbar.
From this set of tabbed pages, the user can find information, about:
•Cursor Info •Audit Trail •Data Browser •Parameters •Stacked Items •Mass Prediction (Mass plugin) •MS Browser (Mass plugin) •Elemental Composition (Mass plugin) •Molecule Match (Mass Plugin) •Mass Peaks (Mass plugin) •Peak Purity Result (Mass plugin) •3D Molecule •Compounds •Molecule Window •SDF Browser •StereoFitter Project Viewer •Arrayed Data (DOSY, T1/T2, etc... processing) •Assignments •Integrals •Multiplets •Peaks •Blind Regions •Line Fitting •Data Analysis •Integral Manager •Multiplet Manager •PCA Results •Phase Correction •Time Domain NMR Quantitation •1H Prediction (Prediction plugin) •13C Prediction (Prediction plugin) •X-Nuclei Prediction (Prediction plugin) •Prediction DB Browser (Prediction plugin) •Spin Simulation (Prediction plugin) •Structure Elucidation •Verification
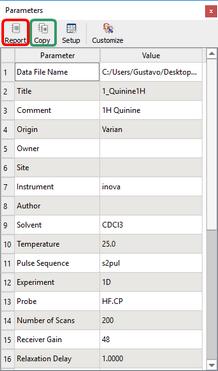
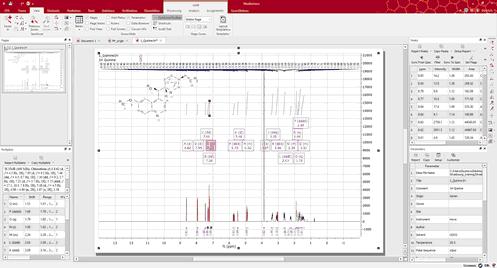
Spectral Parameters: This table shows information about: •Experiment Title •Data File Name •Origin of the Experiment (type of spectrometer used) •The Owner •Solvent Used (CDCl3 in the example below) •The Frequency of the Spectrometer Used to Carry Out the Experiment •Number of Acquired Data Points •Spectral Width •Spectrum Size After FT •Lowest Frequency (in Hz) Used for Referencing Purposes, etc.
Please note that Mnova includes the ability to add more parameters into this list and customize the way it is displayed on the screen. See also: Parameters Table
The user can directly paste the spectral parameters table on the spectrum by clicking on the 'Report' icon (red square in the capture below). You can also export the table to another document by clicking on the 'Copy to Clipboard' (green square in the screenshot below).
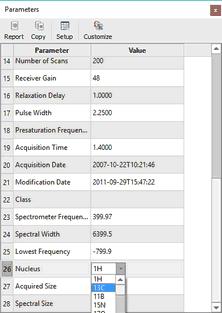
The user will be able to modify some of the parameters (Spectrometer frequency, Spectral Width, Lowest Frequency, Nucleus...) by just double clicking on the value as is shown in the picture below:
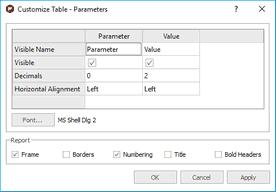
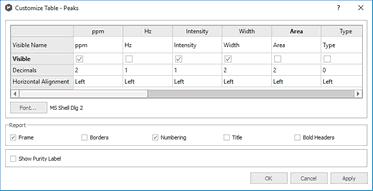
You can customize the table, by clicking on the 'Column or Row Setup'. The 'Customize Table' dialog box will be displayed and will allow you to change the name of the columns, hide them, change the number of decimals as well as the horizontal alignment.
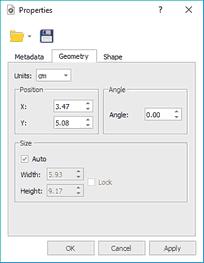
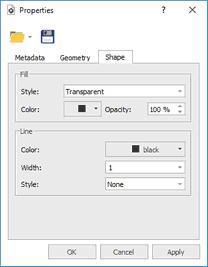
Once any table has been reported, you can change its properties (position, size, fill and border) just by double clicking on it:
See also:
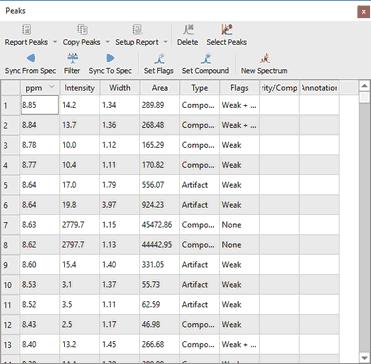
Peak Table: By default, peak frequencies are listed directly on the spectrum but they can also be accessed via the Peak Picking table by following the menu 'View/Tables/Peaks'.
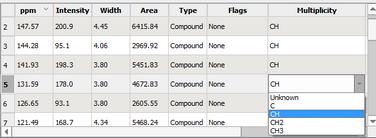
This table displays the list of peaks, including the following information: chemical shift in ppm and Hz, intensity (height), width (width, in Hz, at half maximum of the peak), type (the user can select between 'Compound', Artifact', Impurity' or 'Solvent') and 'Annotations'.
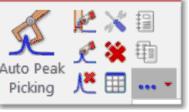
The user can report the Peak table directly on the spectrum by clicking on the 'Report Table' icon
This dialog box will allow the user to change the name of the columns, hide them, change the number of decimals as well as the horizontal alignment. You can change the Font Family and also to customize the appearance of the table report (Frame, Borders, Numbering, Title and Bold Headers).
The user will also be able to select the multiplicity of the carbon signals, just by double clicking in the applicable cell, as you can see in the picture below:
To delete an undesired peak, click on the 'Delete' icon
By default, peak frequencies are listed directly on the spectrum but they can also be accessed via the Peak Picking table and also as a 'Peak List' by clicking on the 'Report Peaks' icon
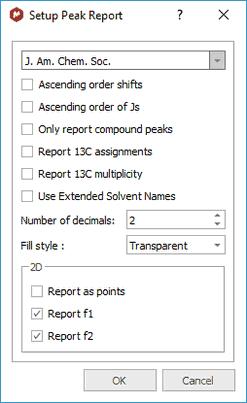
From here you can select the order of the report or only report the compounds peaks.
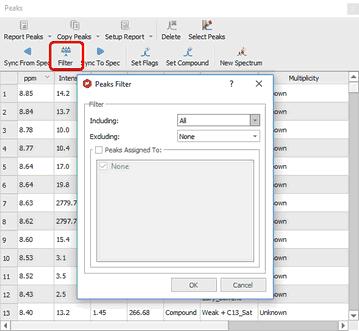
From the Peaks table, you can apply some filter (by clicking on the applicable button) to show for example only Compounds Peaks:
You can synchronize the type of the peaks in the table (i.e: only Compounds peaks) with the peaks showed in the spectrum (by using the button 'Sync from Item') or viceversa, synchronize the spectrum peaks with the peaks showed in the table ('Sync to Item' button).
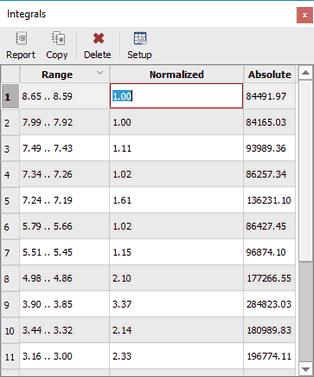
Integral List: The Integrals Table includes information about the integral range (in ppm) and the normalized and absolute values of each integral. In this table the user can normalize the integrals by double clicking on the normalized value of the integral which the user would like to set (in the red square on the capture below). Once it is highlighted, the user has to overwrite the desired value, press return, and all integrals will update with reference to the chosen one. You will obtain the same effect by double clicking directly on the integral label on the spectrum. The user can also delete an integral from this table by clicking on the 'Delete' icon
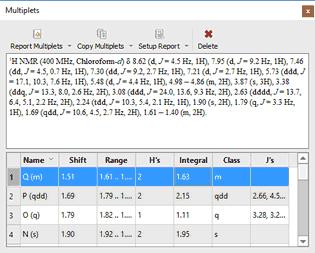
Multiplets: The multiplet table includes information about the name (by default Mnova named the multiplets following the alphabetical order, but the user is able to change it in the multiplet manager), the chemical shift (ppm), the range (ppm), number of hydrogens, integral value, type of multiplet and coupling constant values (Hz).
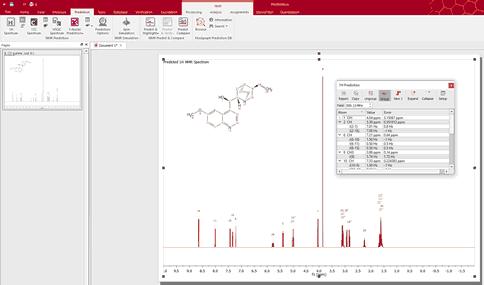
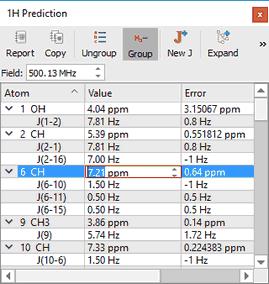
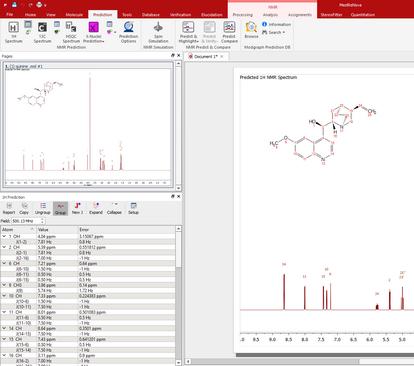
See also 'Multiplets Table. 1H Prediction: In this table, the user can visualize the 1H assignments of the predicted shifts (in NMR Predict mode). As you can see in the picture below, the carbon atoms are labeled to make easy the proton assignment. The user can also select the frequency of the desired predicted spectrum (on the frequency edit box) as well as do (or not) groups magnetically equivalents (by clicking on the suitable icons:
You can also modify the chemical shift and coupling constant values directly from this tables, just by double clicking on the applicable box and entering the desired value.
Please bear in mind that you can also put the table on the 'Page Navigator' just by clicking on the table and dragging it to the 'Page Navigator', as you can see in the picture below:
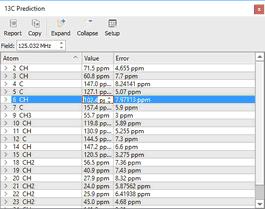
13C Prediction: In this table, the user can visualize the 13C assignments of the predicted shifts (in NMR Predict mode). You can also select the frequency of the desired predicted spectrum (on the frequency edit box). The user can paste the 13C Prediction table directly on the spectrum by clicking on the 'Report' icon
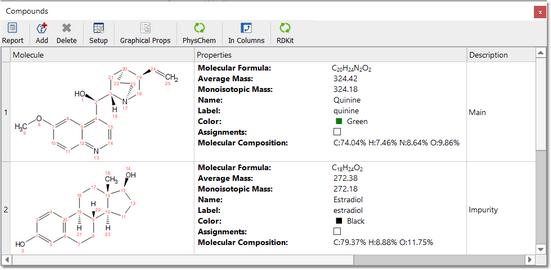
Compounds: This table will show all the molecules present in the document, with information about the chemical formula and molecular weight, name.
You can copy any molecule from this table to another page just by selecting it and clicking on the 'Report' button. Please bear in mind that the information about predictions and assignments is linked to the molecule and will be kept after having pasted it to another slide.
You will be able to dock any table to the right or left side of the spectrum just by clicking on it and dragging to the desired place:
|