What else can I do with GSD?


What else can I do with GSD? |
|
|
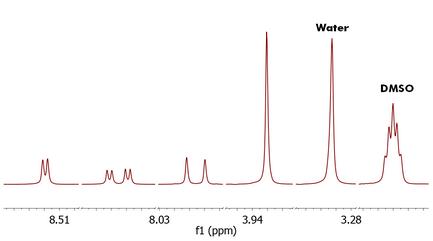
As you have seen above, from the GSD list of peaks you could create a mocked spectrum with enhanced resolution; but in addition you can use GSD for example to remove solvent lines. Consider the following spectrum containing solvent peaks (DMSO/Water):
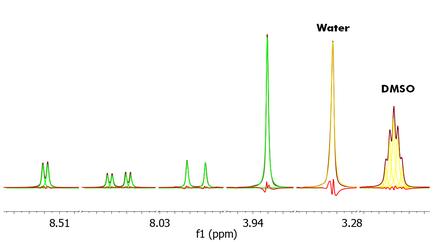
To remove the undesired peaks, just run a Peak Picking with GSD and with the 'Auto Classify Peaks' option enabled, in order to autodetect the solvent peaks (in yellow in the figure below):
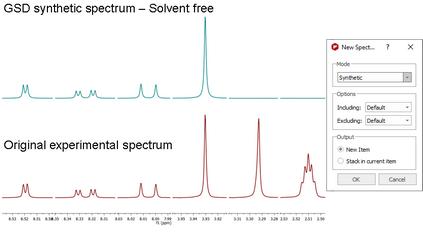
And finally we create a new synthetic spectrum without the solvent lines:
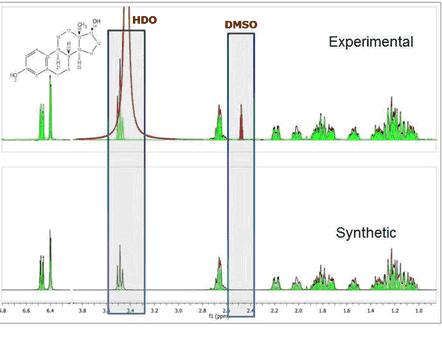
Here you can see another example where the solvent and compound signals are overlapped. Mnova´s autoedit successfully separates a triplet signal sitting on the HDO signal. The approach of generating dark regions used by other software products would miss the triplet at 3.5 ppm and therefore any verification efforts would fail.
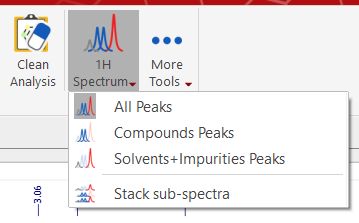
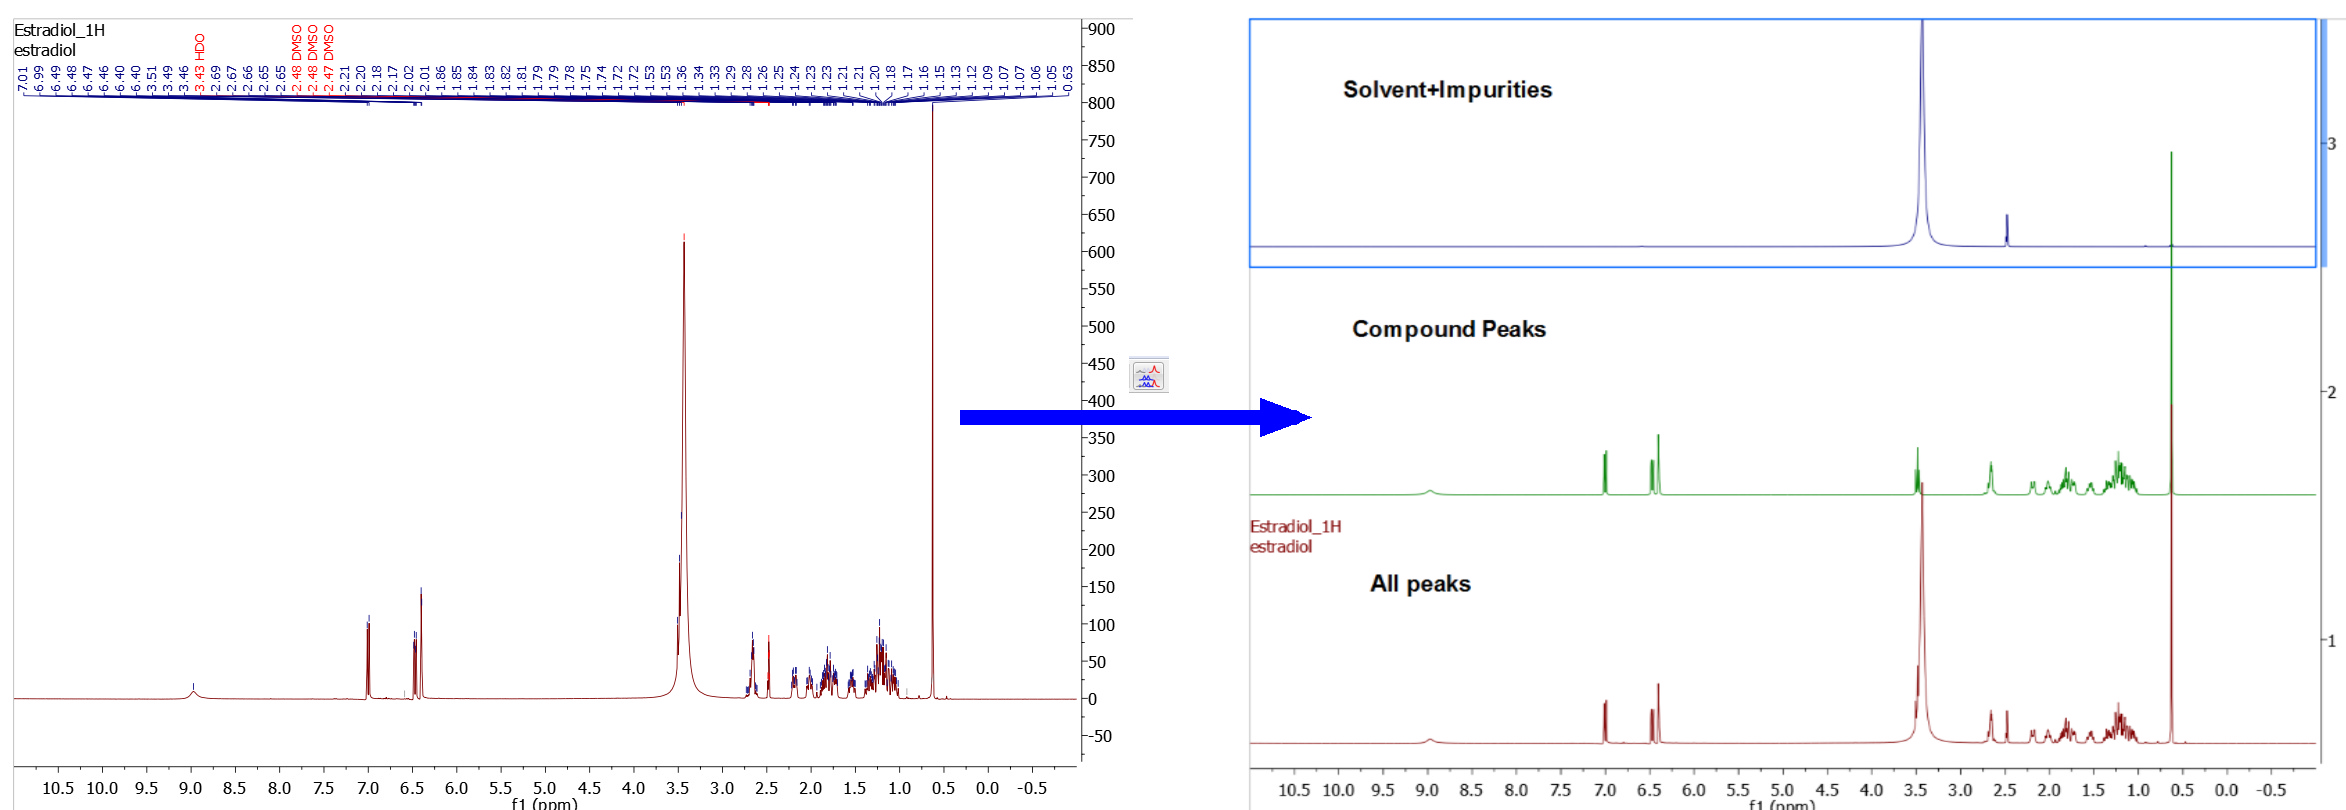
You can display the 1D spectrum with 'All Peaks' (default view) and also to decompose the spectrum into 3-sub-spectra: 1. Containing only the 'compound peaks'. 2. Containing only 'solvent+impurity' peaks. 3. A stack plot with the different views (all, compounds and solvent+impurities):
Here you can find an example of the stacked sub-spectra view obtained from a 1H-NMR spectrum:
|