GSD (Global Spectral Deconvolution)


GSD (Global Spectral Deconvolution) |
|
|
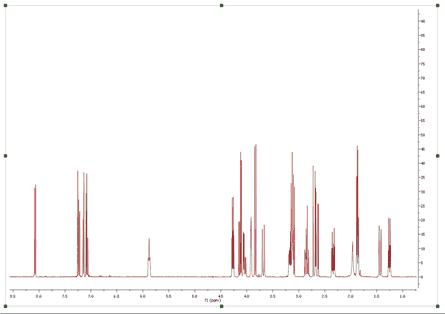
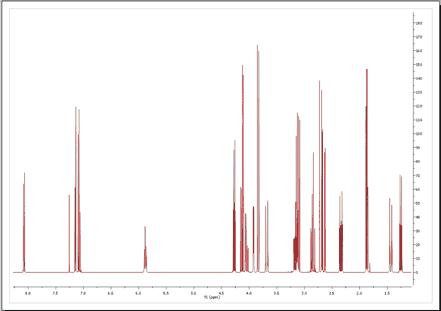
1H NMR is for sure the most powerful technique for structure elucidation, especially for small organic molecules. Typically, an organic chemist uses the chemical shift, coupling constants and integration information contained in an 1H-NMR spectrum to either verify or elucidate an unknown compound. Of course, it’s quite common that a simple 1H-NMR spectrum is not enough to unambiguously confirm a structure and thus other NMR experiments (e.g. 13C-NMR, HSQC, COSY, etc) are used to get more structural information. Nevertheless, we have often found that many organic chemists do not always try to get the most out of 1H-NMR spectra (which is the cheapest experiment), in particular when some multiplets are complex to interpret (due to the strong coupling) or when peaks overlap prevents valuable information to be detected in some multiplets. As it is well known, there are two principal factors limiting the resolution power in a spectrum. First, we have the natural line width limitation imposed by the T2 (spin-spin relaxation). For example, if T2 is about 1 second, the peak linewidth at half height cannot be less than 0.32 Hz (remember, line width at half height = 1 / (pi * T2) = 1 / 3.1415 = 0.32) no matter how powerful is our NMR instrument or the field homogeneity. On the other hand, there are instrumental shortcomings (e.g. spatial uniformity of the applied magnetic field, etc). Nonetheless, there is an additional limiting factor, and whose importance is generally underestimated which has to do with the generally large number of transitions in 1H-NMR spectra. In short, the peaks we can observe in a 1H-NMR are just a small fraction of the actual transition resonances which are not observable because of the limited digital resolution. In fact, every peak in an 1H-NMR spectrum is basically an envelope of a large number of transitions and its shape is dominated by the coupling pattern of the spin system. Even in molecules of modest size the number of distinct peaks is tens to thousands times smaller than that of quantum transitions. These problems have been the motivation of the development of a brand new peak analysis algorithm, the so-called GSD (Global Spectral Deconvolution); which applies automatically a deconvolution of the whole spectrum in a few seconds and does not require that the user set a starting point for the fitting of each multiplet. Let´s see the GSD in action. Just open a 1H-NMR spectrum:
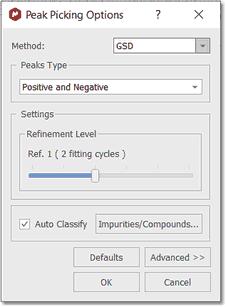
Select GSD as the Peak Picking method (in the Peak Picking Options) and apply a Peak Picking which will to carry out the deconvolution of the whole spectrum. See also: "Using GSD for multiplets analysis"
Automatic multiplet deconvolution will be applied to the whole spectrum without asking the user to select multiplets, specify number of lines and their approximate locations, etc… Everything is automatic! (Ideally, data would be zero filled to 64K points and line broadening functions would not be used.).
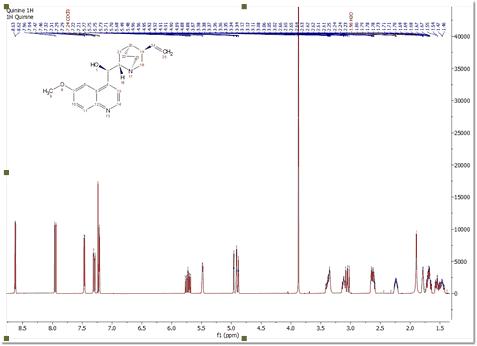
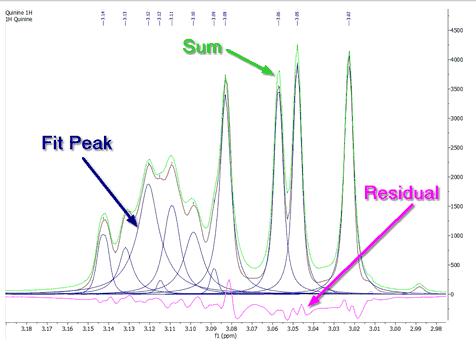
Let´s expand an area to see how the algorithm works:
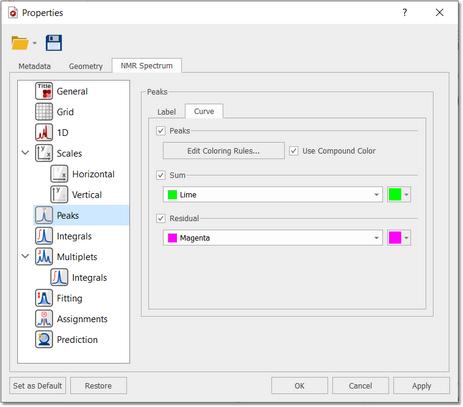
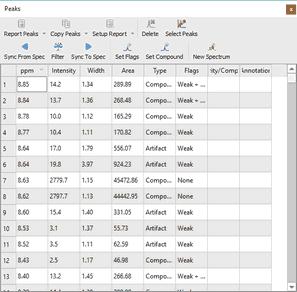
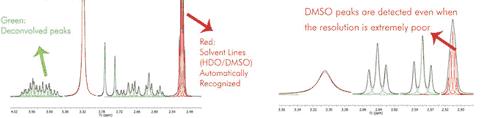
As you can see in the picture above you will obtain a blue line to show the fit peaks, a magenta line to show the residue and lime line to show the sum. It’s very important to realize that the result of GSD is just a list of peaks, but each peak is fully characterized (chemical shift, Peak Width, Height, Phase, Area, etc). To see the list of the GSD peaks just follow the menu 'View/Tables/Peaks' (or right click on any toolbar and select 'Tables/Peaks'):
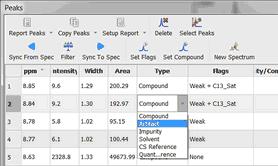
This table contains information about the chemical shift, width, height, Area, Type and Flags. Double click on the applicable cell (or on the 'Set Flags' button) to manually edit the 'Type' and the 'Flags' table. To change the flag to several peaks at the same time just hold down the Ctrl/Cmd key and click.
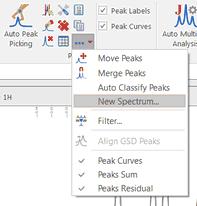
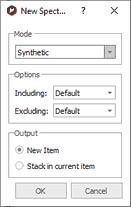
Once you have edited your GSD spectrum, you can generate a new spectrum with the fit peaks, just by selecting 'New Spectrum' in the Peak Picking scroll down menu:
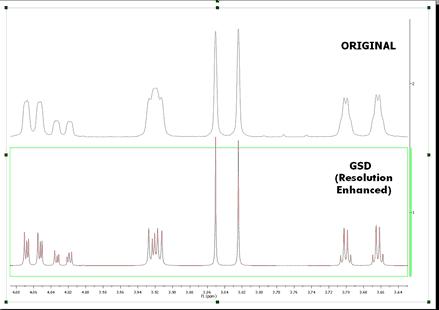
This will display a dialog box from where you will be able to select the mode of the new spectrum (Synthetic, Sticks, Uniform Line Width or Proportional Line Width). From here you can also excludes the peaks with a specific 'Type or Flag' and you can get the spectrum a new item or stacked with the original one. We will generate a new spectrum with a proportional Line Width of 0.3, including only the peaks marked as compound (without artifacts, solvents, impurities, etc.) Here is the result of the New spectrum from GSD:
You will see in the picture below an expanded region of the original spectrum and the GSD one in stacked one. As you can see, now you will be able to measure the coupling constants more accurately, as only the compound peaks are displayed and they are displayed at an artificially increased higher resolution
Follow the menu 'Tools/Export ASCII/GSD Spectra' to export the GSD peaks as ASCII.
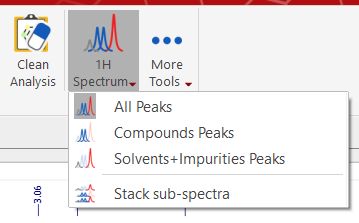
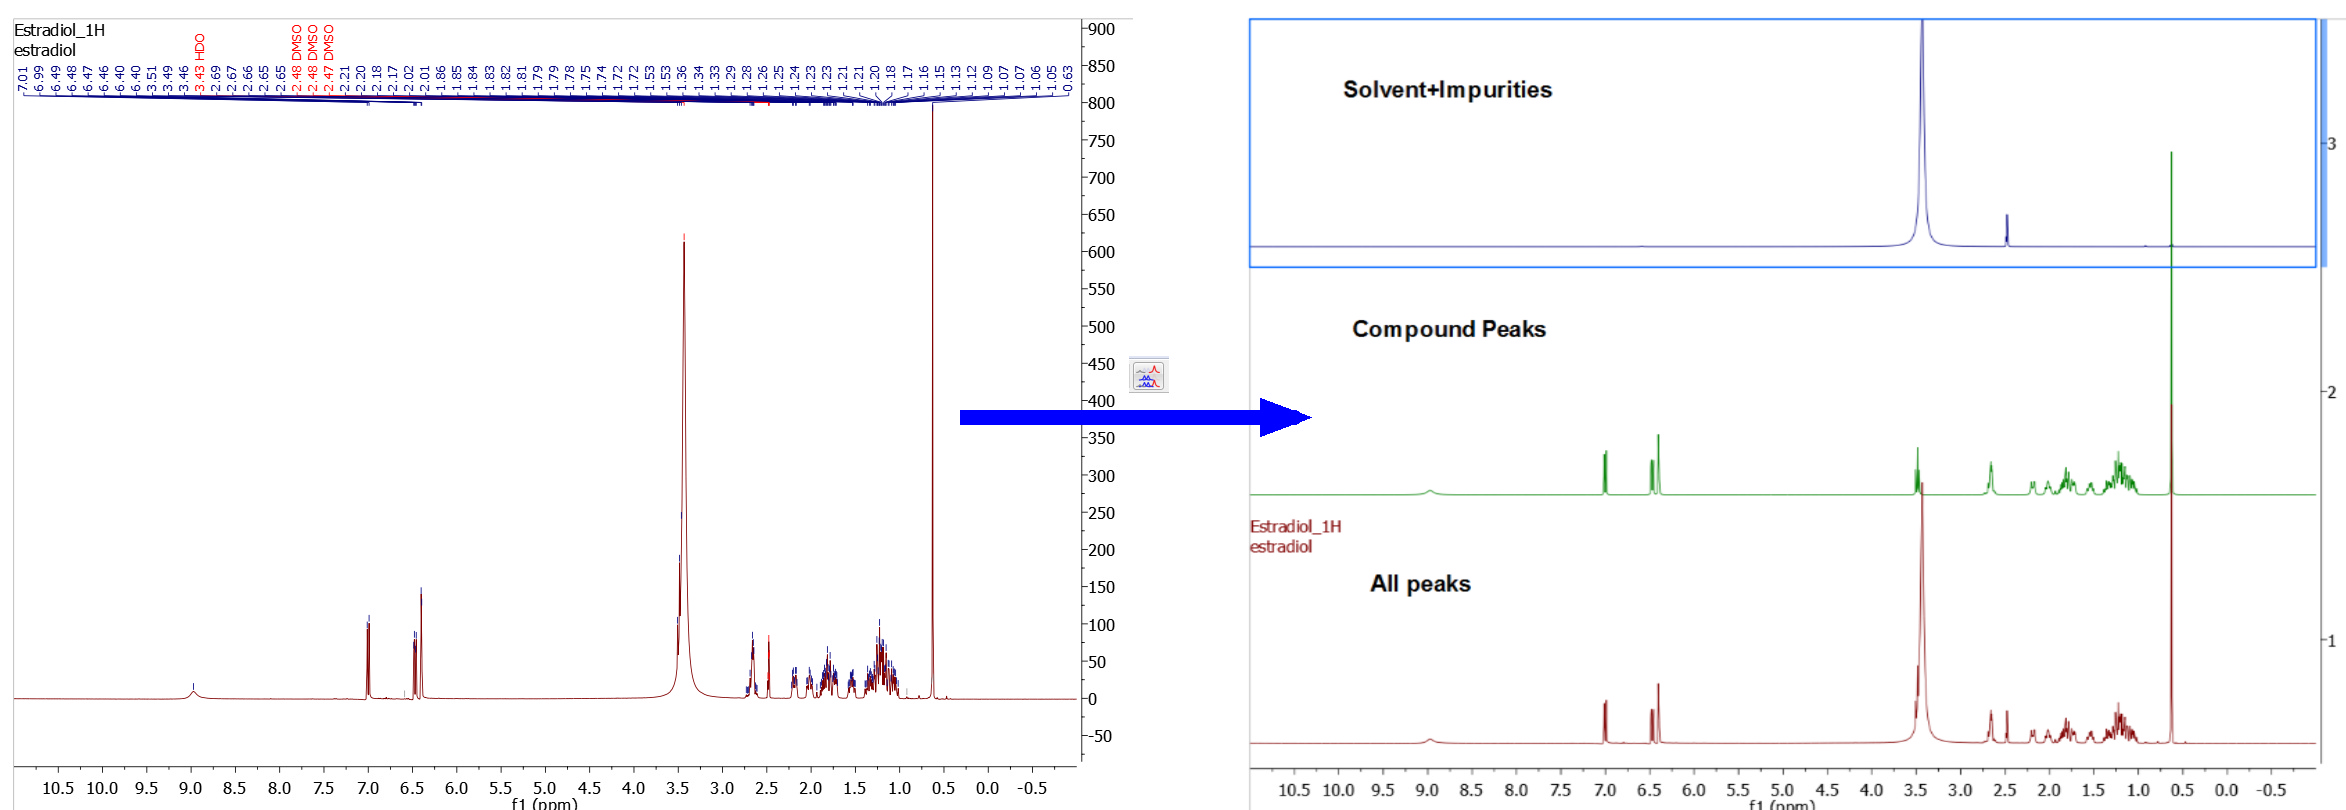
You can display the 1D spectrum with 'All Peaks' (default view) and also to decompose the spectrum into 3-sub-spectra: 1. Containing only the 'compound peaks'. 2. Containing only 'solvent+impurity' peaks. 3. A stack plot with the different views (all, compounds and solvent+impurities):
Here you can find an example of the stacked sub-spectra view obtained from a 1H-NMR spectrum:
Improving GSD with Line Fitting After the GSD peak picking, allow the user to define a line fitting region, and it uses all the GSD-peaks in that region as the starting peaks. The user changes the peaks and then re-fit the peaks as usual, until satisfied. The Peaks table gets automatically updated every time a peak is modified in the Line Fitting panel. |