Data Analysis Quick Start Guide


Data Analysis Quick Start Guide |
|
|
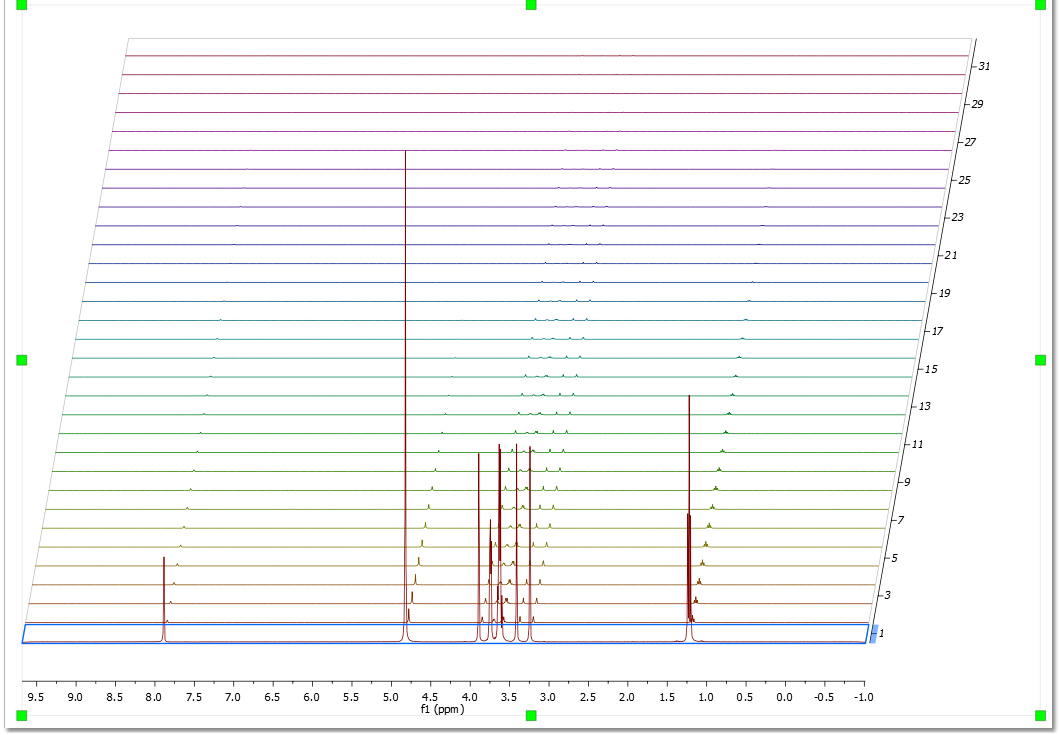
First of all, please make sure that you are familiar with stacked plots. Take a look at this chapter for further information.
Let´s see how the Data Analysis feature works. Just load your experiment into Mnova:
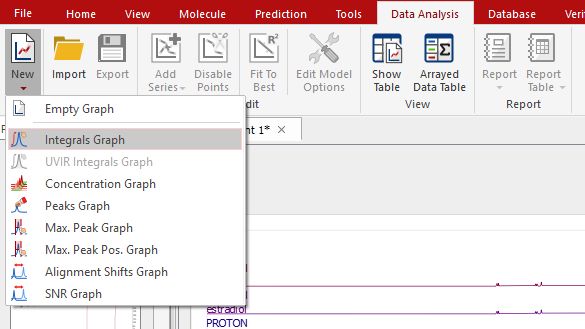
Follow the menu 'Data Analysis/New' and select the desired graphical representation. In that case 'Integrals Graph':
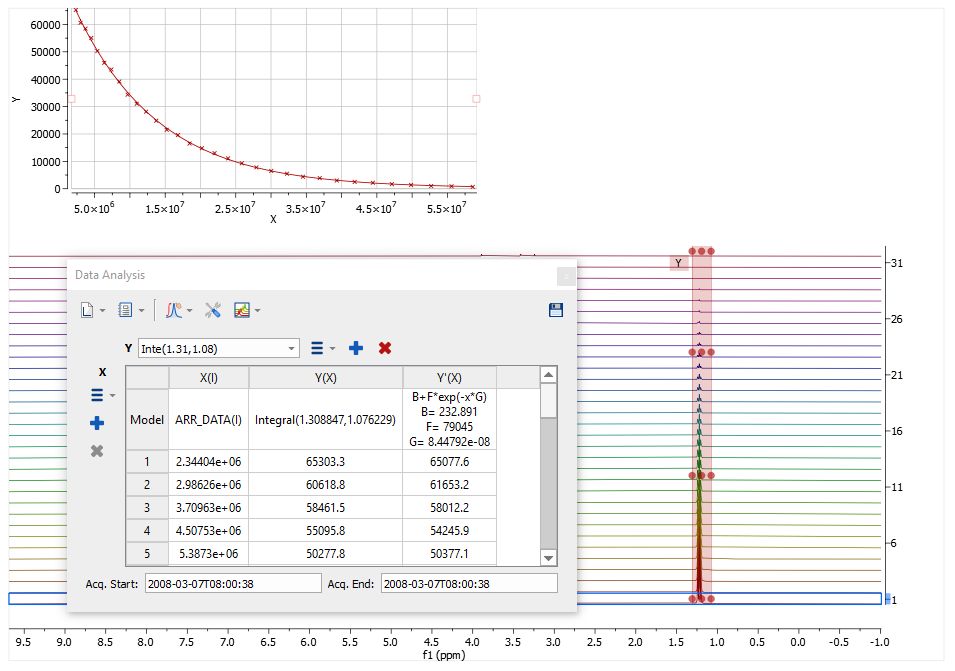
You will notice how the cursor will change to a blue integral. Now you will only need to integrate the desired signal (in this case, we will select the signal at 1.20 ppm). Once you have integrated the desired region, you will notice how the graphical will change according with the decay of the signal. Please bear in mind that all values will appear in a tabulated form in the Data Analysis panel
NOTE: the integration calculation method used in the Data Analysis will be the one selected under the 'Integral Options' (Analysis/Integration/Options).
Finally, allow Mnova to try to guess the order of the reaction, fitting the data to standard equations and comparing the mean square error. To do it just follow the menu 'Data Analysis/Edit/Fit to Best'.
You can also set the 'Fit to Best' option by default by selecting 'Fit Function=Best Fit' on the 'Edit Model Options'.
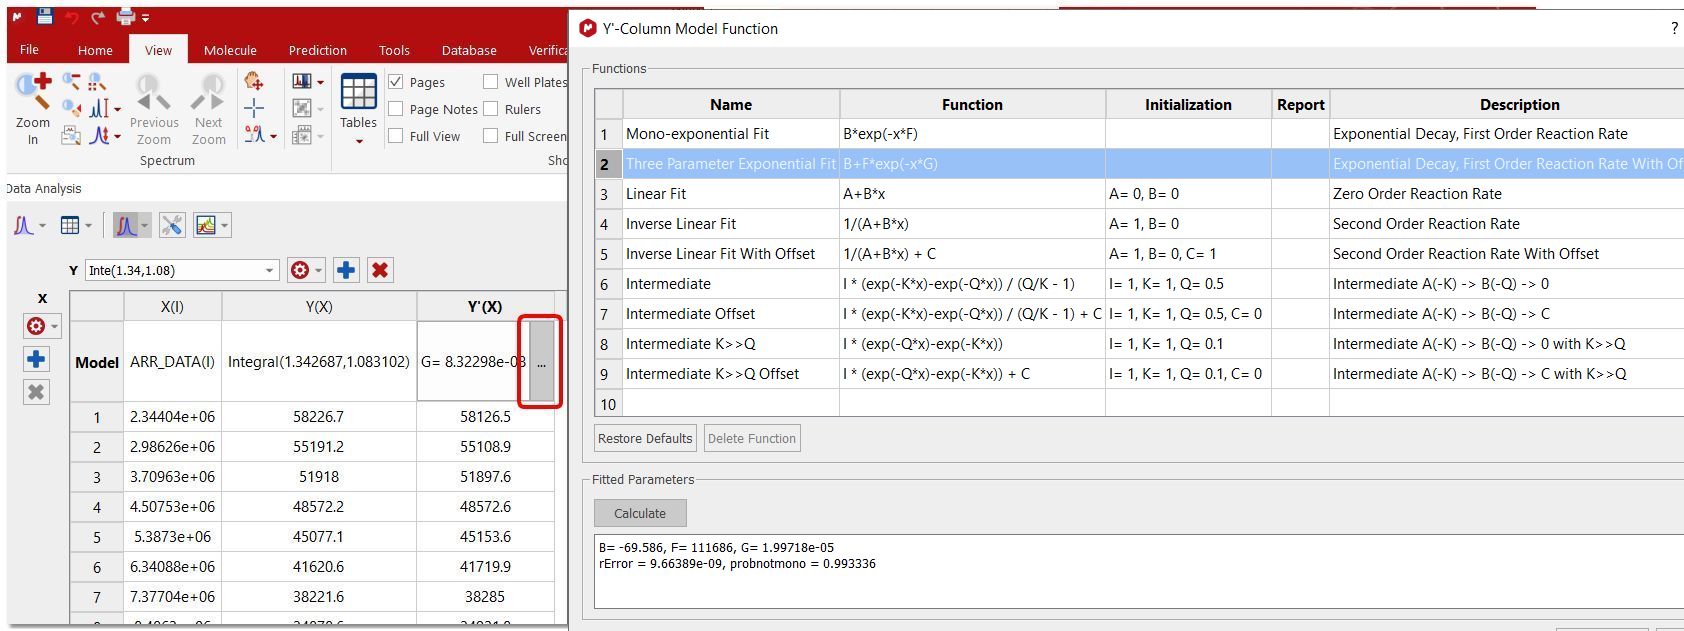
You will find the result of the fitting in the 'Data Analysis' panel (Data Analysis/Show table). In that case, the best fit would be a 'Three Parameter Exponential'. If you are not happy with the fitting, just click on the first cell of the column Y'(X) to select any other function:
NOTE: The Probnotmono value is important to assess whether or not the model for the fit we are assuming, in this case, a three parameter-exponential model satisfies. For instance, if you assume a mono-exponential model but the experimental data follows a bi or multi-exponential behavior, then the analysis will not be fully correct. On the other hand, if we assume that the model is mono-exponential, the ‘rError’ value gives the [absolute] probable error in the value of ‘r’, where ‘r’ is: y = a*exp(-r*x)+b
This error is calculated based on the assumption that the final residues correspond to the actual noise in the data. |