Stacked NMR Processing


Stacked NMR Processing |
|
|
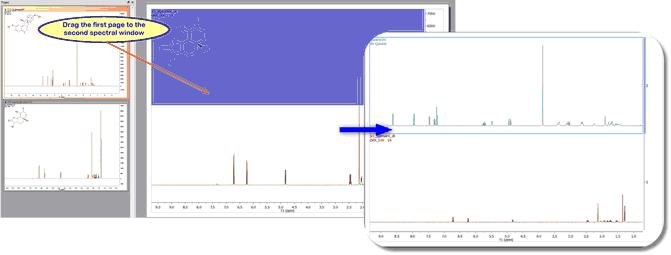
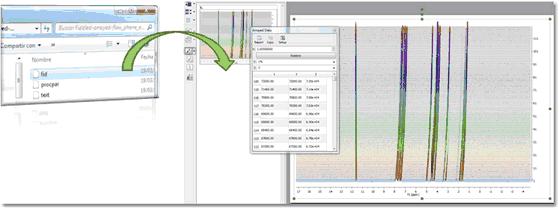
Many types of experiments require obtaining a series of FIDs, related to each other through the variation of one or more parameters (temperature, concentration, solvent...). The user, for example, may need to run several spectra at different temperatures: 270K, 300K, 330K, 360K and 390K. Instead of acquiring five different sets of data, the user is able to create an array in which the temp parameter is given for successively different values. Creating a stacked (or pseudo 2D) spectrum with Mnova is very easy; just by dragging one spectrum from the 'Page Navigator' to another spectral window. In the example below we are dragging the first page into the second spectrum to generate a stack plot:
You can use this method to add a spectrum to an existing stack. In the example below we are adding the spectrum in the second page as the trace 19th of the stacked plot:
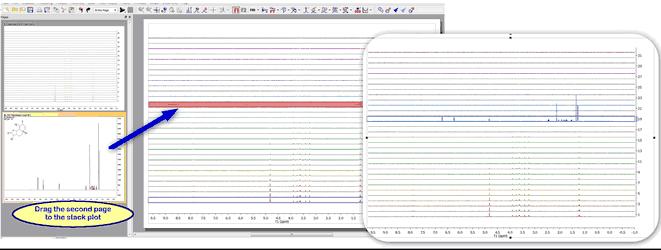
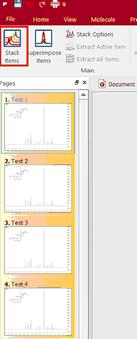
You can also create a stack plot by selecting the desired spectra in the page navigator (by holding down 'CTRL/Cmd key' while clicking on each spectrum) and then issue the command 'Stack/Stack Items':
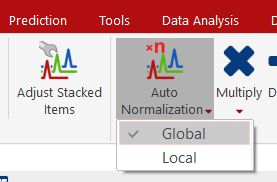
You can also normalize the traces of your stacked plot by clicking on the 'Auto Normalization button, which has a dropdown menu to select if the action applies to the full spectrum (Global) or to the zoomed region (Local).
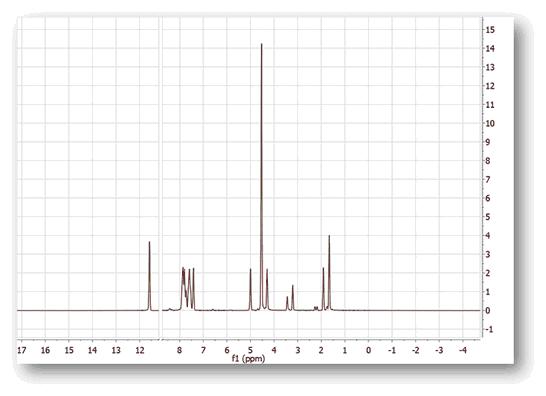
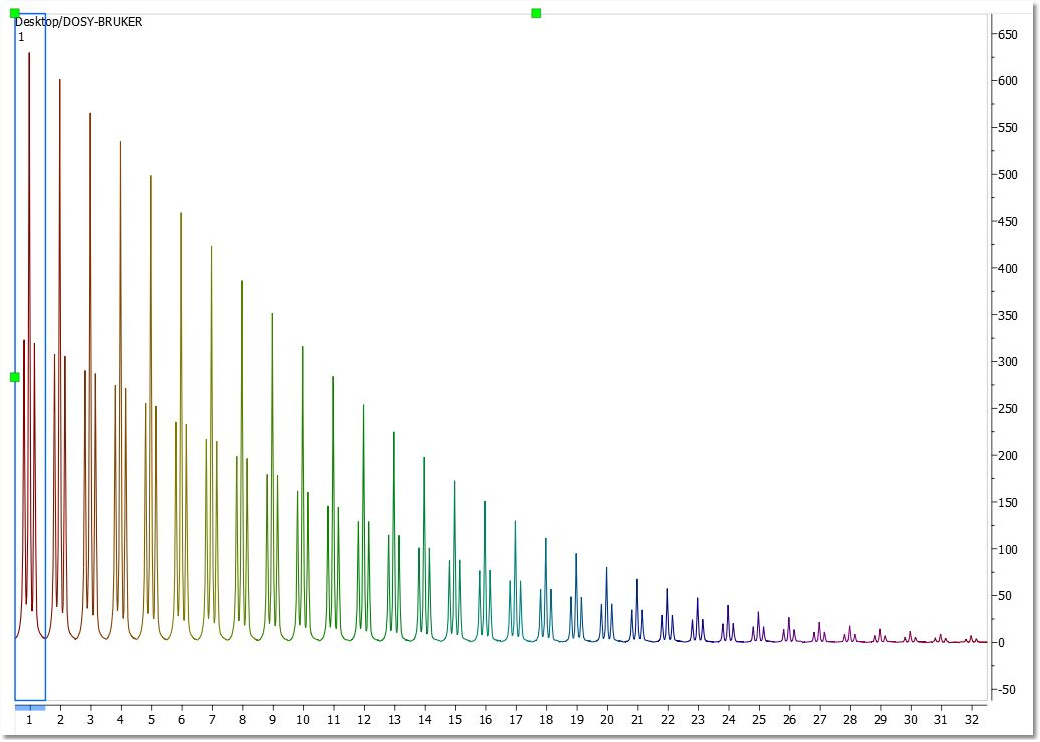
Additionally, Mnova can detect spectra which have been acquired in the so-called arrayed-mode (or pseudo 2D), typically used in relaxation, kinetics or diffusion experiments. For all these cases, Mnova will only process the acquired dimension (t2). Basically, Mnova will process only the rows of the data matrix and, by default, will display the spectrum as a stacked plot (see below):
You can also import all the spectra from the same folder and create a stacked plot by using the 'Directoy Spectra Stack' script from the 'Tools/Import' menu.
Display Modes:
The main features to handle arrayed spectra will be described below:
• Multiple display modes: Stacked, superimposed, active, bitmap, horizontal stacked. • Ability to select multiple spectra and apply processing only to those selected spectra • Ability to hide any number of spectra • Multiple selection can be done either graphically in the stacked plot mode or by means of a table • New powerful algorithm for the automatic alignment of arrayed spectra • Ability to automatically import any number of spectra and automatically stack them • New selection mode to extract NMR descriptors (e.g. integrals) with the ability to adapt its shape to any profile (useful when peaks are not aligned)
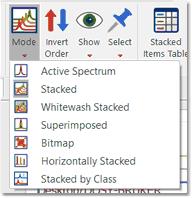
As you well know there are several display modes of arrayed datasets, as stacked, superimpose, active or bitmap. You can select the mode by using the applicable scroll down menu:
'Active Spectrum': to see only the highlighted spectrum. Within this mode, you can navigate along all spectra in this stack by using Shift+Mouse wheel (or arrow keys up&down).
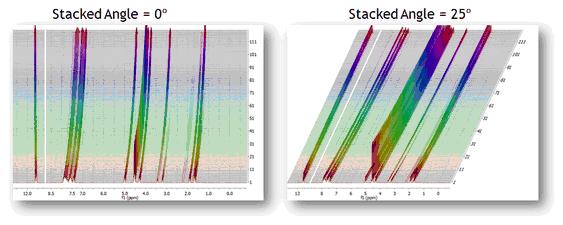
'Stacked': to see all the spectra in arrayed mode. You can change the angle from the Properties dialog box.
'Superimposed': to see all the spectra overlayed (one over another).
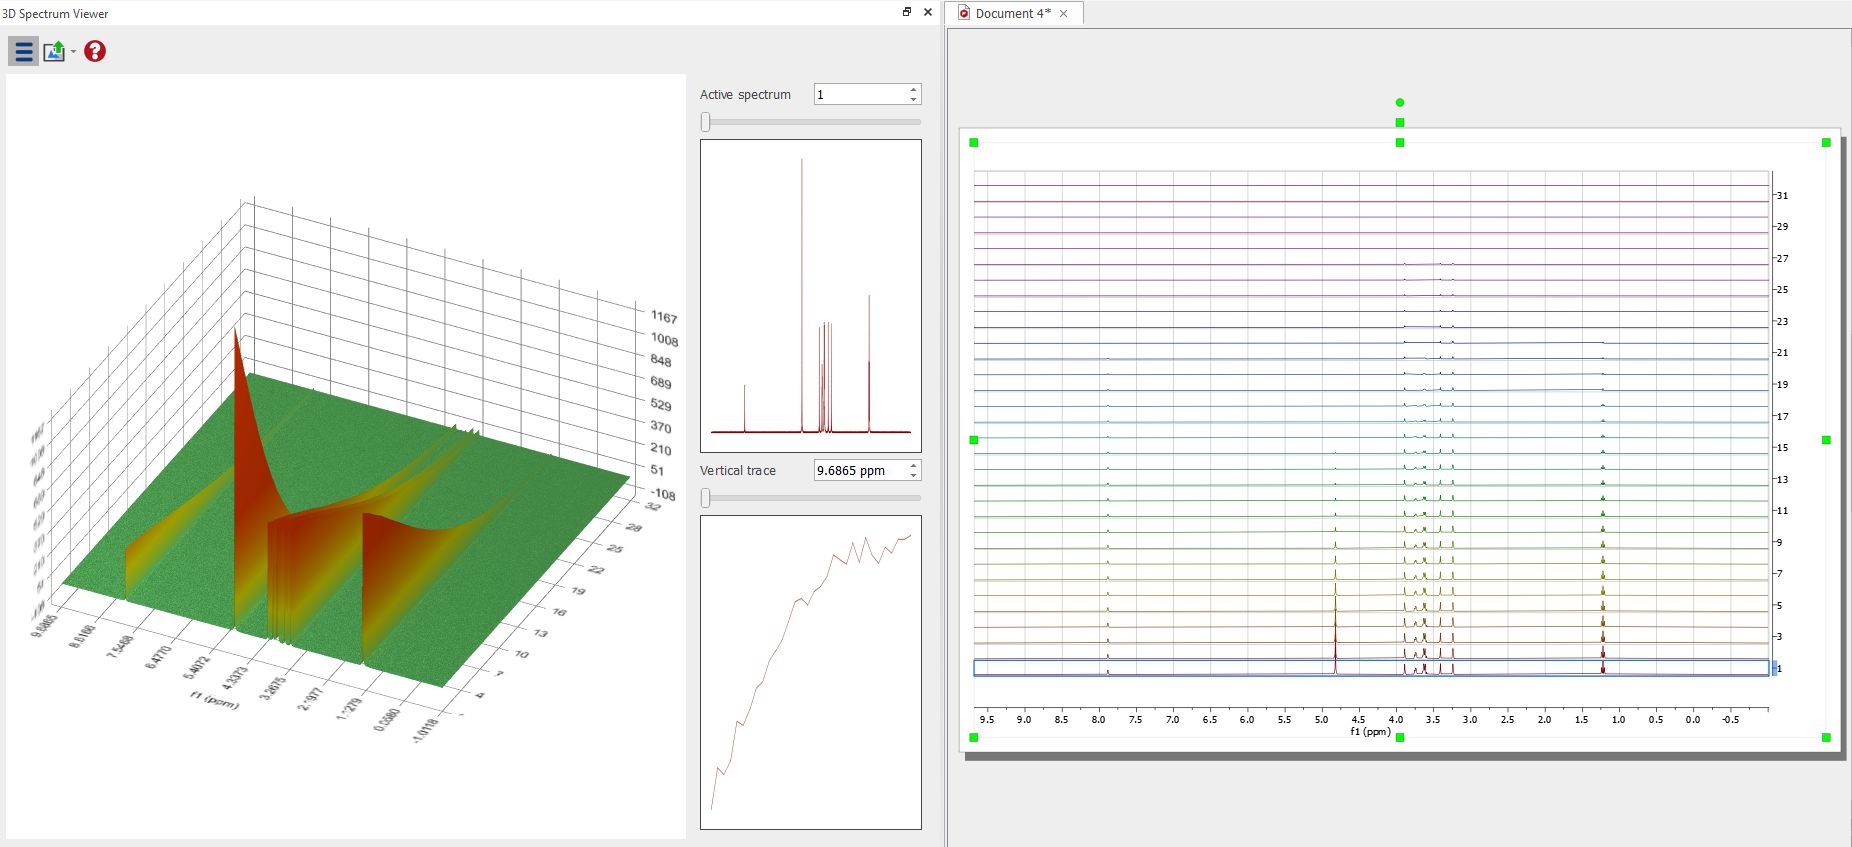
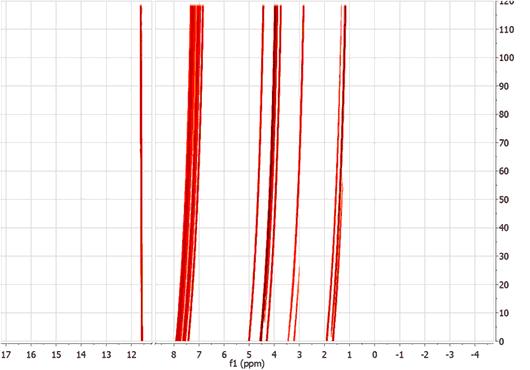
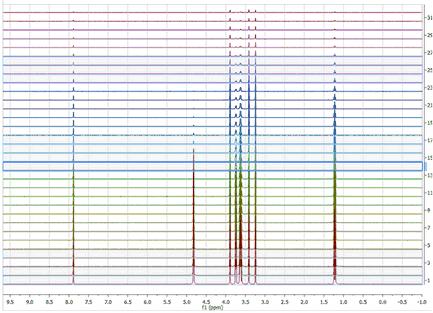
Loading a stacked plot of 1D NMR spectra will also display the result in the 3D viewer:
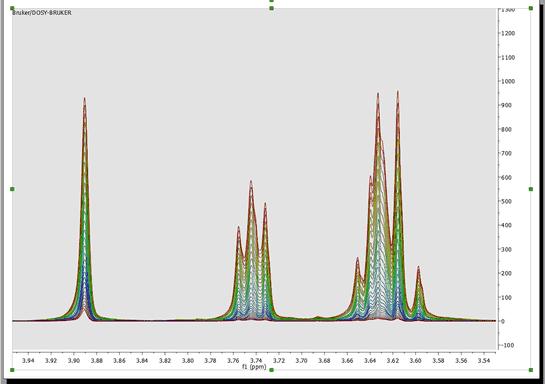
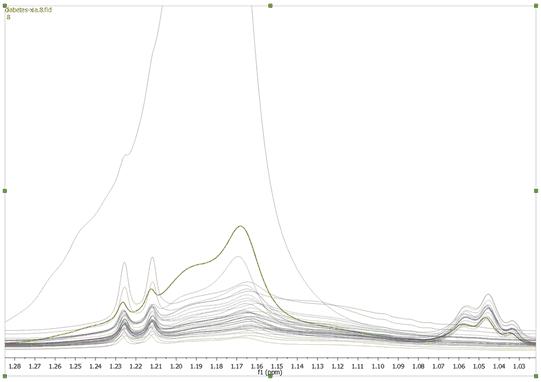
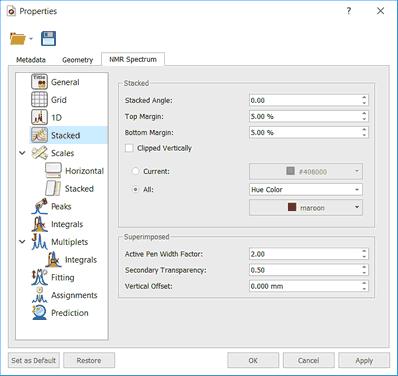
For metabolomics studies it is important to superimpose multiple spectra and compare their shape, e.g. to identify which ones are outliers. In such a mode, when the user sets a spectrum as the Active spectrum, that spectral curve will be displayed with a thicker curve: Follow the menu 'Home/Properties/Stack' to customize 'Active pen width factor' (2.00 by default) and 'Secondary Transparency:
'Bitmap': too see all spectra in a bitmap mode.
Horizontal Stacked:to display the spectra horizontally stacked.
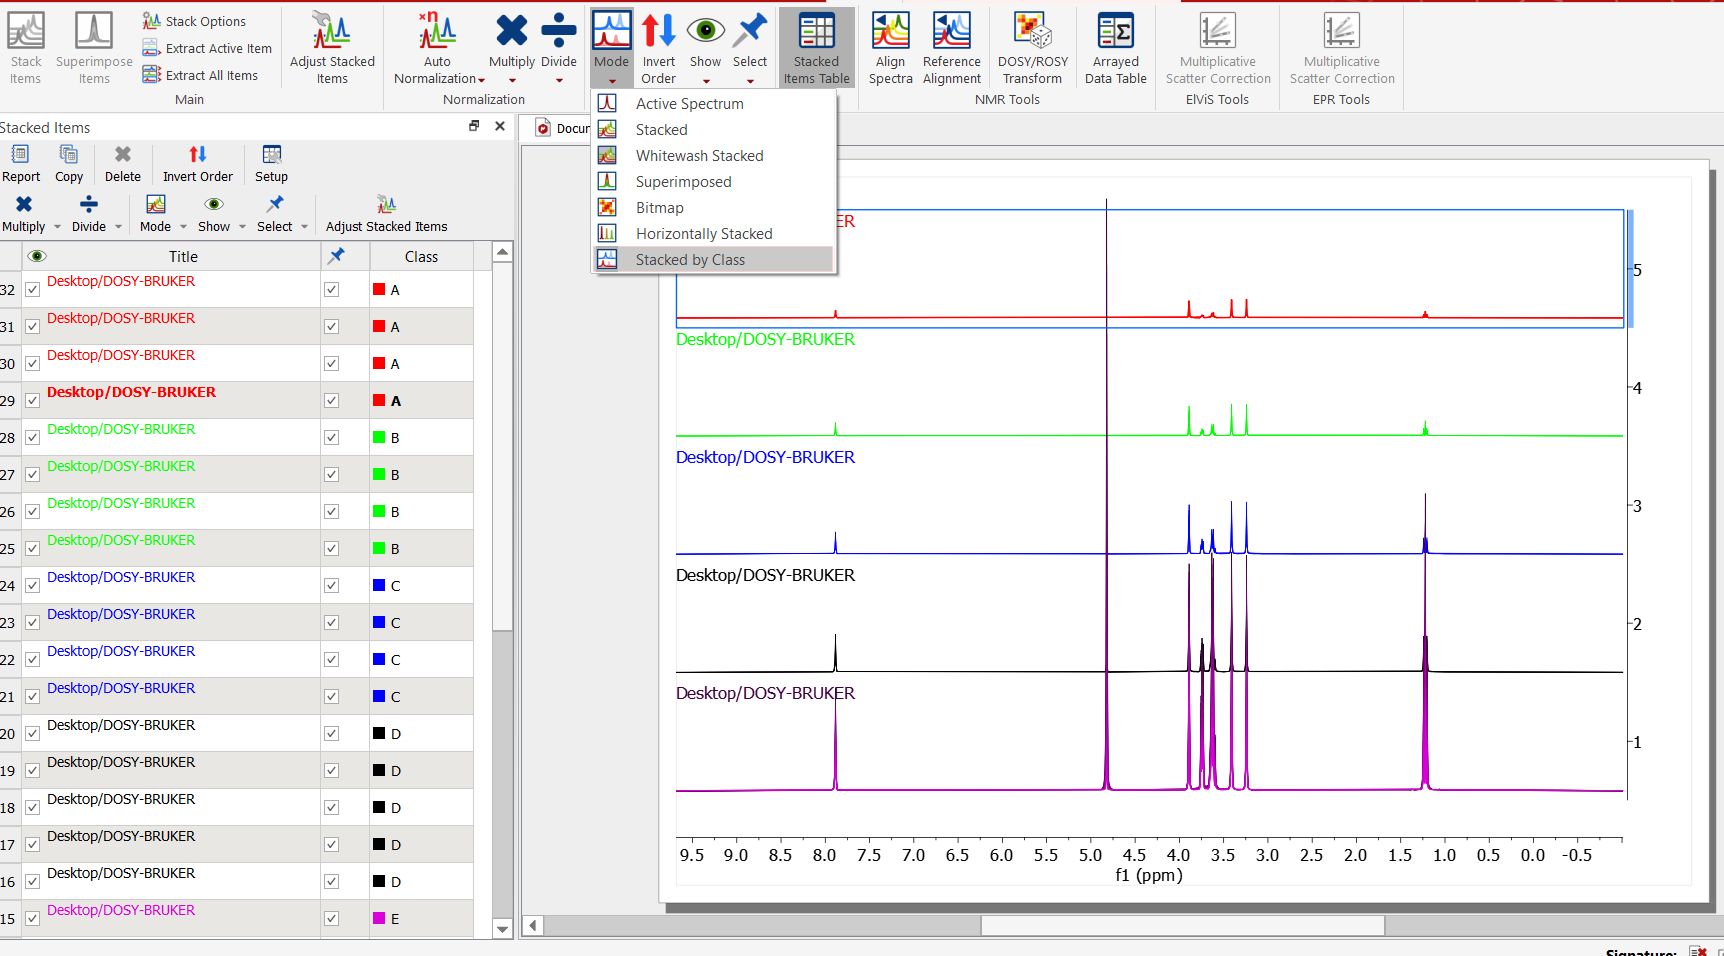
Stacked by Class The Stacked by Class mode is similar to the Stacked mode, but in this case all items of same class are stacked as superimposed in the same row of the stack. Items without class are superimposed together in the same row.
When no sorting is selected, the original order of the items is kept as much as possible (considering that they are grouped by class)
When titles are visible, the title of the active item is shown in the corresponding row, the title of the first item of the class is shown if the active item is not one of that row
Multiple Spectra Selection
Mnova includes a powerful, yet easy to use multiple spectral selection mode, which allows the user to optimize the processing of groups of spectra by selecting a bunch of spectra and applying any processing (e.g. manual phase correction to the selected group)
Multiple spectra selection can be done either graphically from the stack or directly from a table
In addition, Mnova offers the ability to hide any number of spectra in an arrayed item.
Graphical selection of spectra
In order to be able to select a bunch of spectra graphically with the mouse, it is necessary to display the spectra in the stacked plot mode.
To select a single spectrum, left click on the spectrum trace while keeping pressed the Alt key To deselect a spectrum: left click + Ctrl + Alt
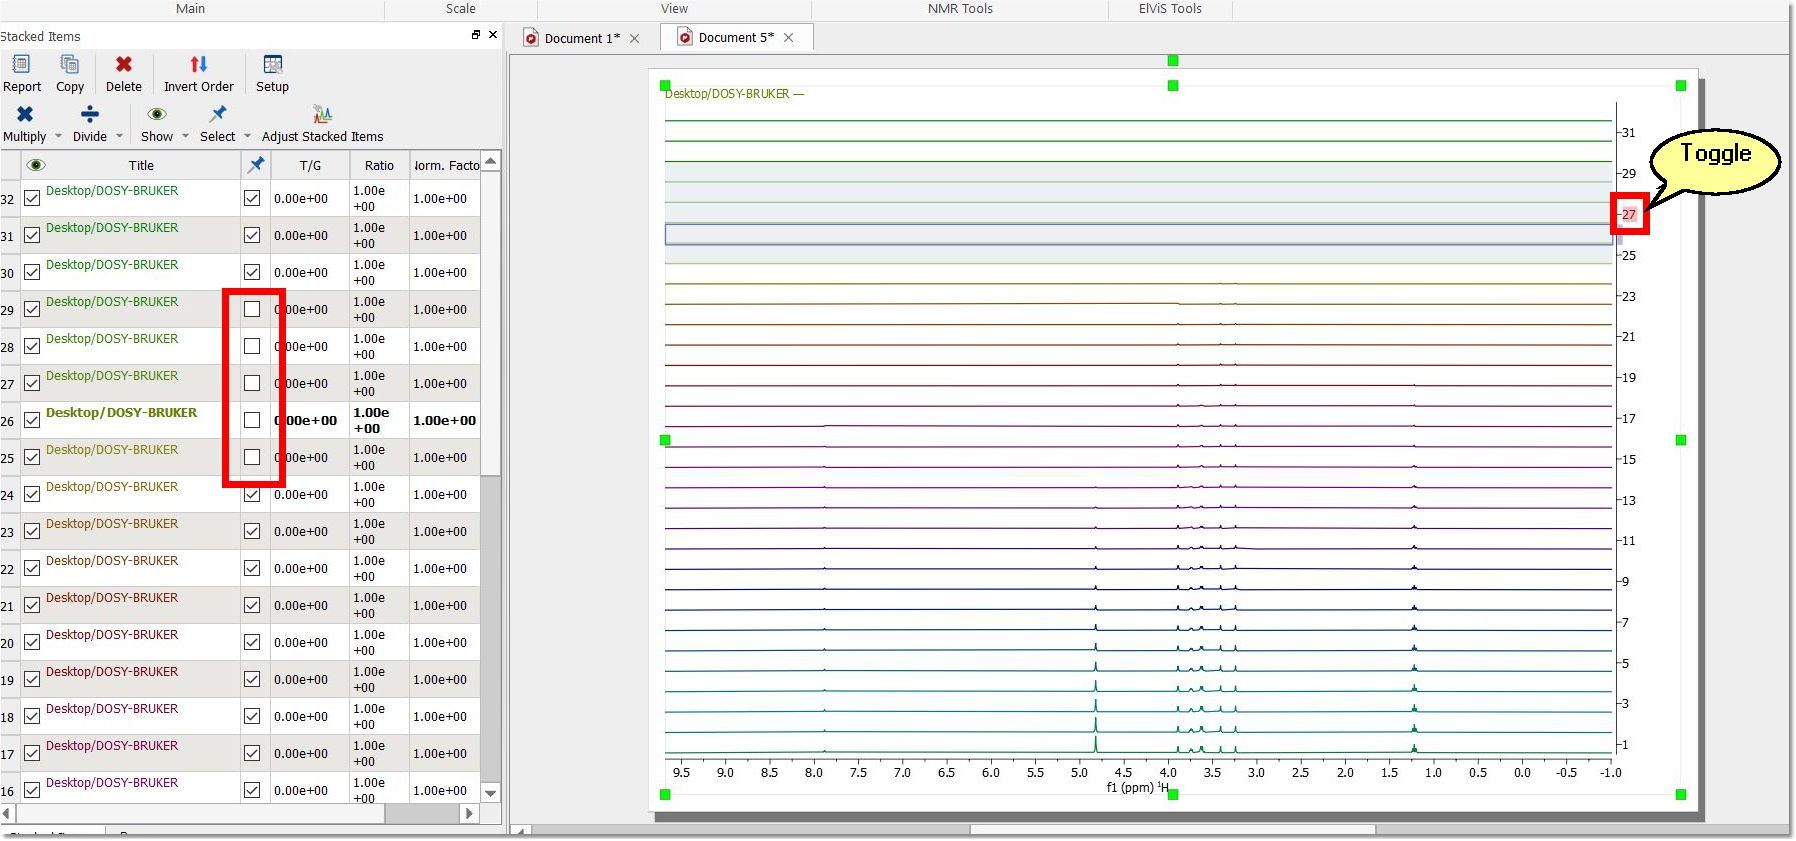
By default all the stacked items are selected and a gray shade is drawn only when they are unselected. You can toggle the item selection by clicking in the category axis labels when the axis is visible.
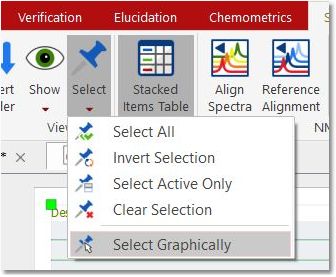
There is a mode to select the items graphically (it will only work on Stacked and Horizontally Stacked display modes)
1.Pressing and holding Shift will append to the current selection. 2.Pressing and holding Ctrl will subtract from the current selection. 3.And without any of those keys pressed it will set the current selection.
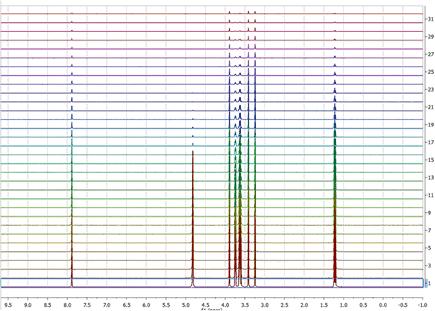
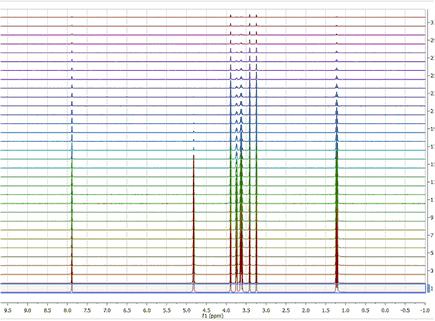
In order to select multiple spectra, follow the same operation as above while keeping pressed Alt and/or Shift keys. The following slide will show how to select several groups of spectra
Some important concepts: Active spectrum vs Selected spectrum/spectra
Selected spectra: when the spectra are selected, they are highlighted with a light blue background. Any processing operation will take place only for those selected spectra Active Spectrum: active spectrum is marked with a blue box and it indicates the spectrum which will be displayed in the active spectrum display mode. It’s also the reference spectrum used in some processing operations (e.g. alignment)
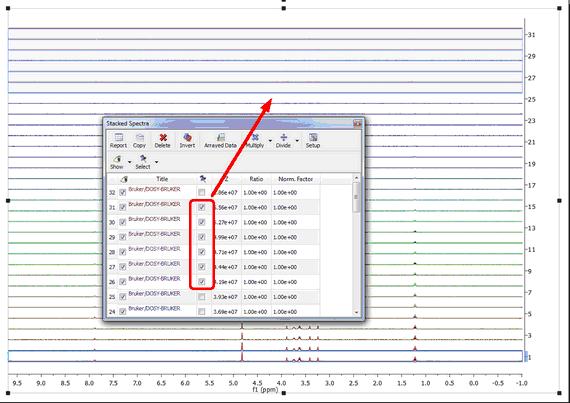
You can also select several slides by using the check boxes on the right of the 'Stacked Items Table'. When the spectra are selected, they are highlighted with a light blue background. Any processing operation will take place only for those selected spectra.
Example #1: If there are no spectra selected and the active spectrum is not either selected (i.e. no spectra have a blue background) then any processing operations will be applied to ALL spectra (Active spectrum is not selected)
Example #2: If only the active spectrum is selected, any processing operations will be applied ONLY to the active spectrum. (Remember, to select a spectrum: left click + Alt)
Example #3: In general, any processing operation will be applied only to the selected spectra (and remember that if no spectra are selected, All spectra will be processed):
See also 'Table of stacked items'
To navigate through the traces in the stack plot, press and hold down SHIFT and use the up or down arrow key (or use the mouse scroll wheel). The active trace will be highlighted by default with a blue rectangle, whilst selected traces will be highlighted with a light blue background (those marks will not be exported whit the stack plot). Any processing operation will take place only for those selected spectra.
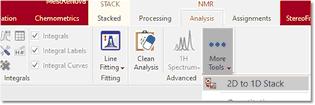
Please note that in strange cases, Mnova shows some arrayed datasets as 2D plots. In those cases just follow the ribbon 'Analysis/More Tools/2D to 1D stack':
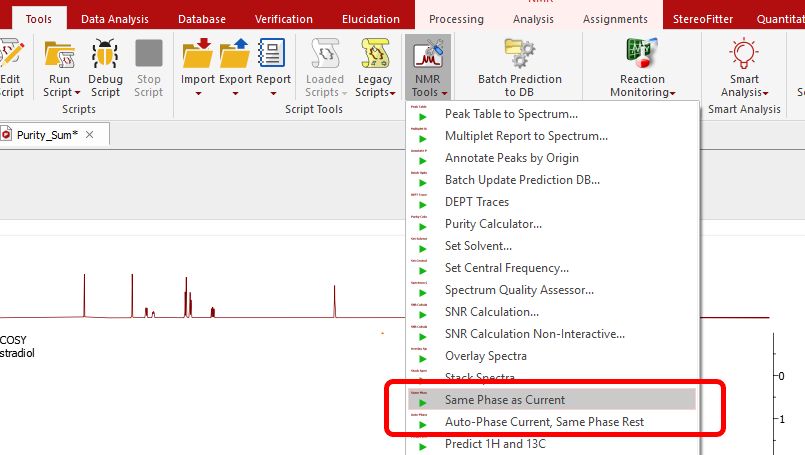
Scripts to autophase importing autophase stacked spectra when importing. Following the menu 'Tools/NMR Tools', you will find a couple of scripts to apply automatic phase correction to a stacked plot:
•Auto-Phase Current, Same Phase Rest: the active spectrum is automatically phase corrected, and the resulting values of PH0 and PH1 are applied to the other spectra in the stacked. •Same Phase as Current: PH0 and PH1 values of the active spectrum are applied to the other spectra in the stacked.
|