How to apply a peak picking or an integration analysis in stacked mode?


How to apply a peak picking or an integration analysis in stacked mode? |
|
|
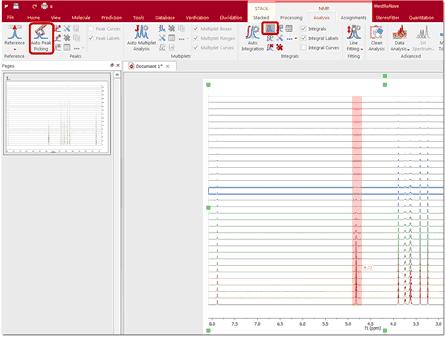
It is very easy to apply a peak picking or an integration analysis to a stacked spectra, just by clicking on the corresponding icon (or selecting the desired analysis function). In the picture below, we have applied an automatic peak picking and a manual integration of several areas of interest:
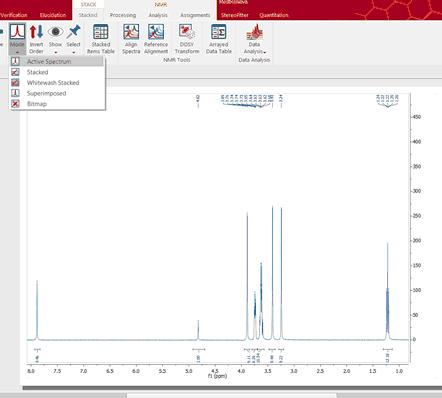
Then, just select 'Active Spectrum' under the 'Mode' scroll down menu to obtain only the highlighted spectrum and you will be able to see the integrals and the peak picking. To navigate through the traces, press and hold down SHIFT and use the up or down arrow keys (or the mouse scroll wheel):
Finally you can export the peak picking or the integration analysis to a text file by following the menu File/Save as/Script:ASCII Matrix or 1D Integral Series (*.txt). This will generate a text file which can be loaded into Excel (for example). Saving as "Script: NMR CSV Matrix (.txt)" you will get the zoomed area of all spectra distributed in columns (blind region and cut areas will be filled with zeroes). If you save it as "Script: NMR CSV Matrix (Transposed) (.txt)" you will get them in rows.
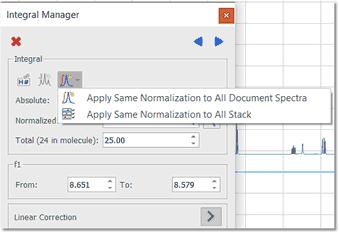
The user can apply the same integral normalization to all the spectra (in the current document) or to all the traces of a stack plot by selecting the applicable option from the 'Integral Manager' (shortcut: SHIFT+I):
This is very useful if you need for example to determine relaxation times from a series of 1D spectra, to be able to compare the integral values between the different traces. |