Data Analysis


Data Analysis |
|
|
Mnova incorporates a 'Data Analysis' feature for the analysis of diffusion experiments. This feature covers also relaxation (T1/T2) experiments, kinetics, reactions monitoring, etc.
With this feature you will be able to extract the peak intensities and integrals in a tabular form from series of 1D NMR experiments and to draw graphical representations of the extracted values as well as any fit results.
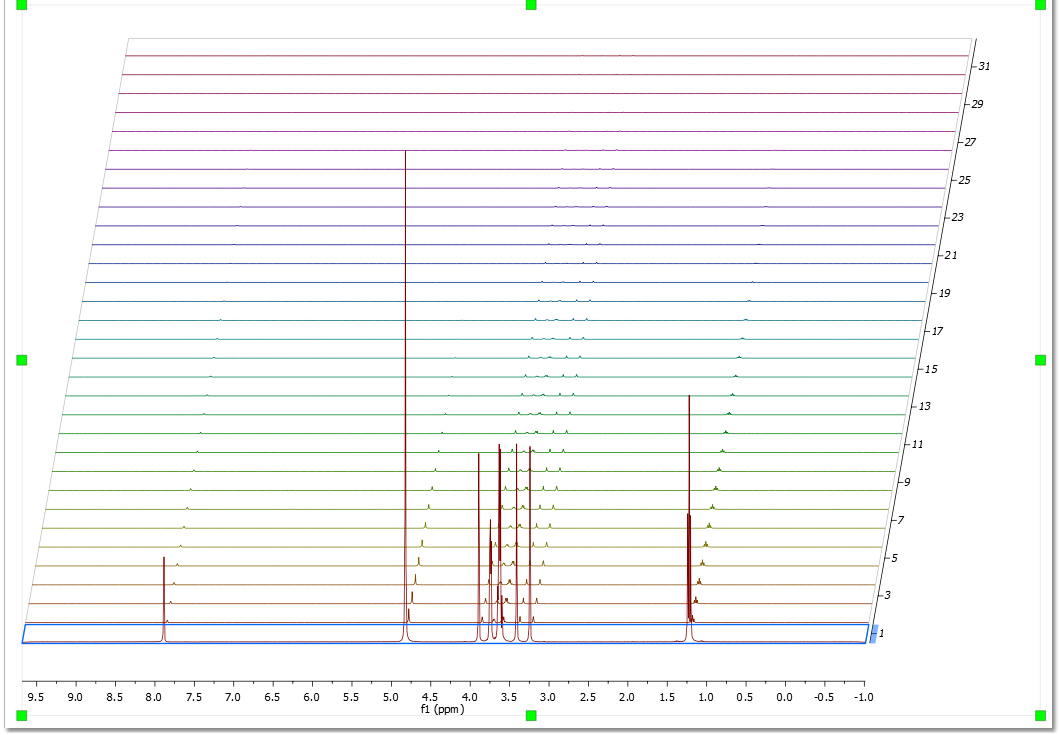
Let´s see how this feature works in the case of a diffusion sample. Just load your experiment into Mnova:
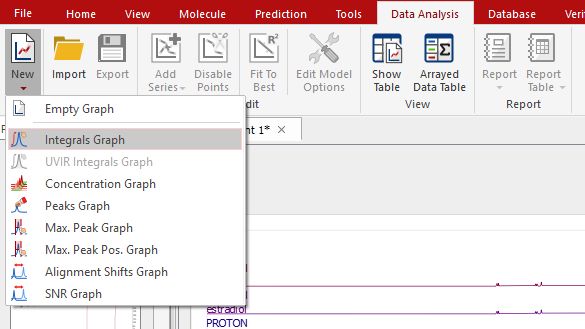
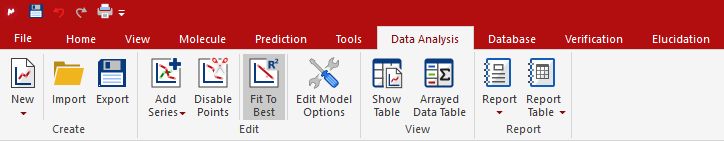
Follow the menu 'Data Analysis/New' and select the desired graphical representation (Peak Integrals, Concentrations, Intensities, or Maximum Peak Intensity, Alignment shifts and also SNR Graph).
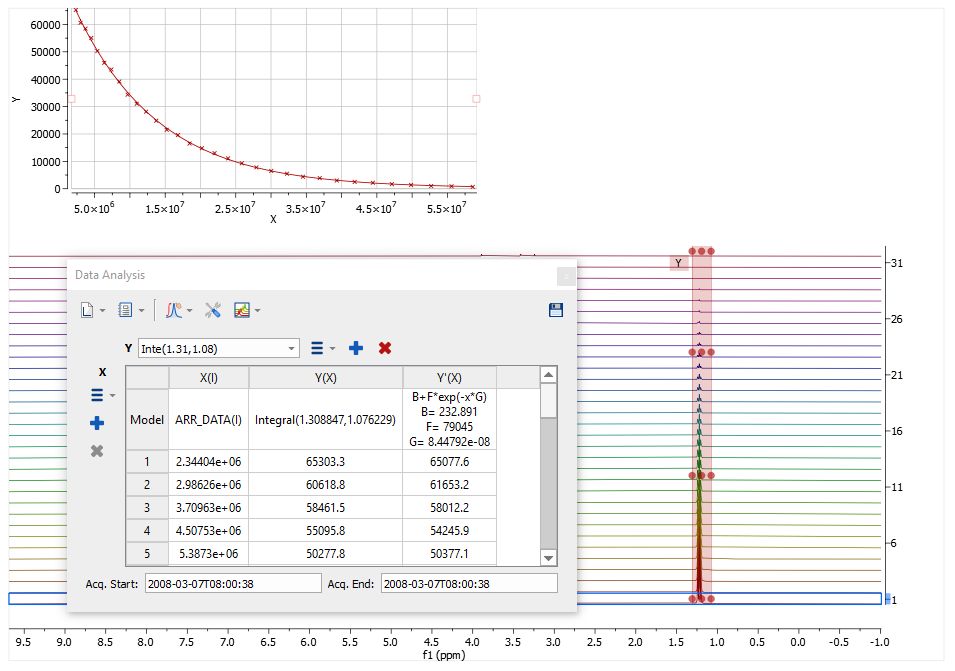
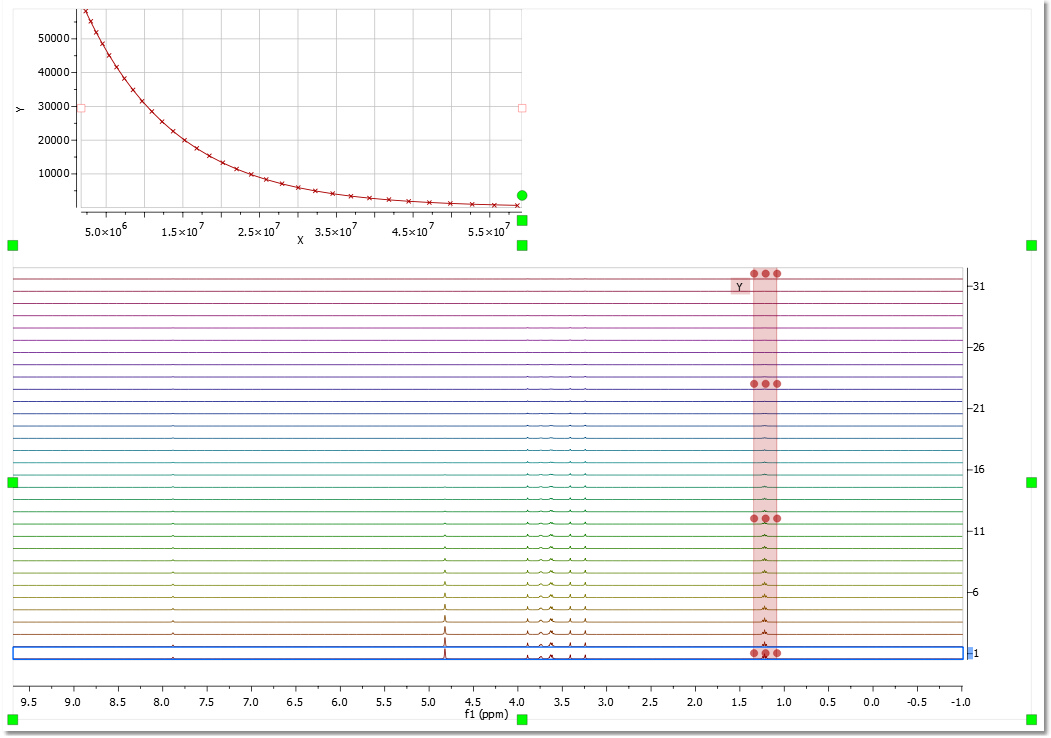
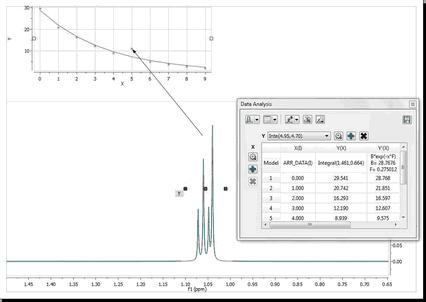
Let´s select for example the 'Integrals Graph' option; you will notice how the cursor will change to a blue integral. Now you will only need to integrate the desired signal (in this case, we will select the signal at 1.20 ppm). Once you have integrate the desired region, you will notice how the graphical will change according with the decay of the signal. Please bear in mind that all values will appear in a tabulated form (in this case the integral values) and you will be able to export them to 3rd party apps for further post-analysis or reporting (just by clicking on the 'Copy to Clipboard' button
NOTE: the integration calculation method used in the Data Analysis will be the one selected under the 'Integral Options' (Analysis/Integration/Options).
Go to this chapter to see a fully description of the Data Analysis panel
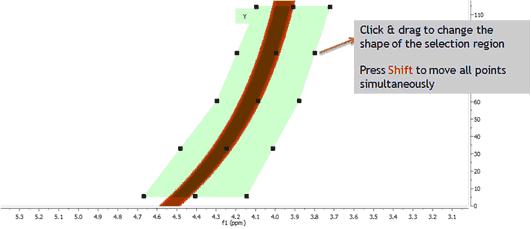
Please notice, that the integrated region will be highlighted in green and will contain several handles to modify the ranges of the integration just by clicking&dragging them (which will be really useful for 'reaction monitoring' in order to account for peaks movements). Holding down the 'shift' key, whilst you click and drag on any of the handles, will shift all the handles together of the same vertical.
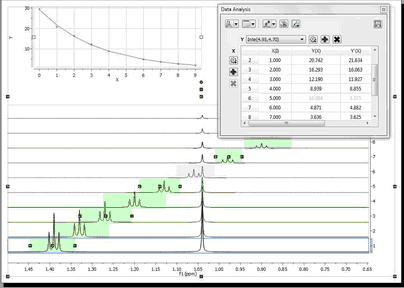
This new selection method works with any displaying mode: bitmap, stacked, active spectrum … The picture below shows this with the stack mode
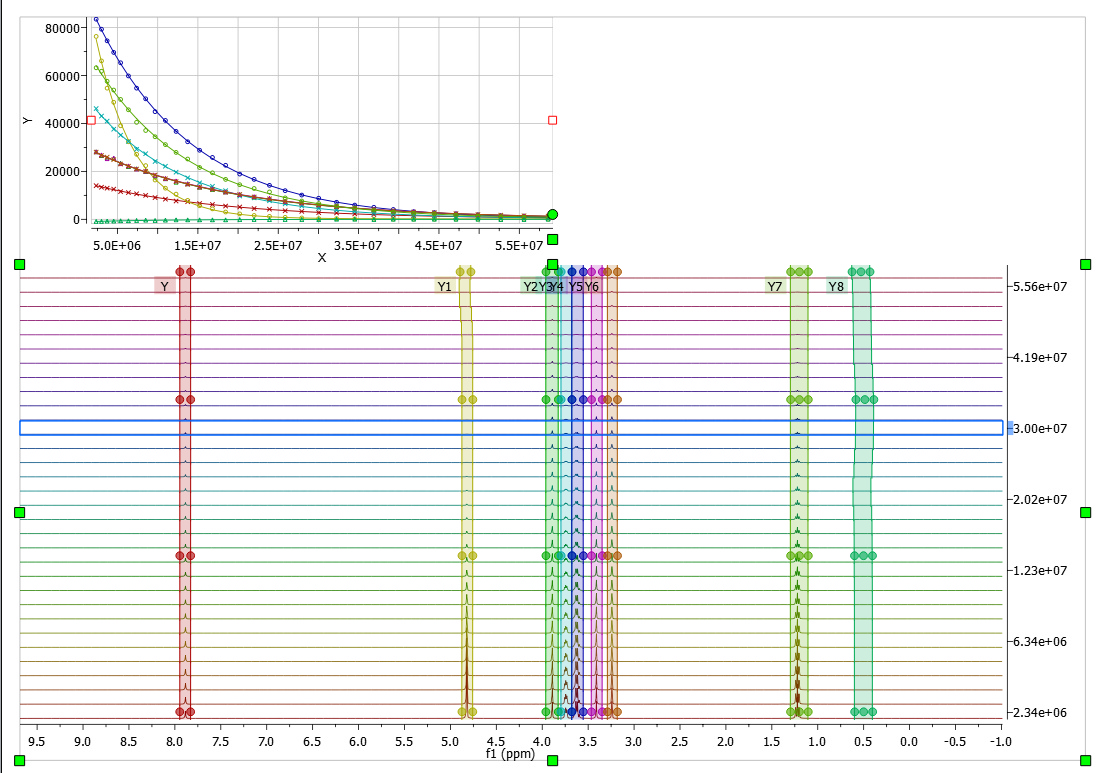
Here you can see another example, where the graphical tool can be very useful to follow the evolutions of the signals:
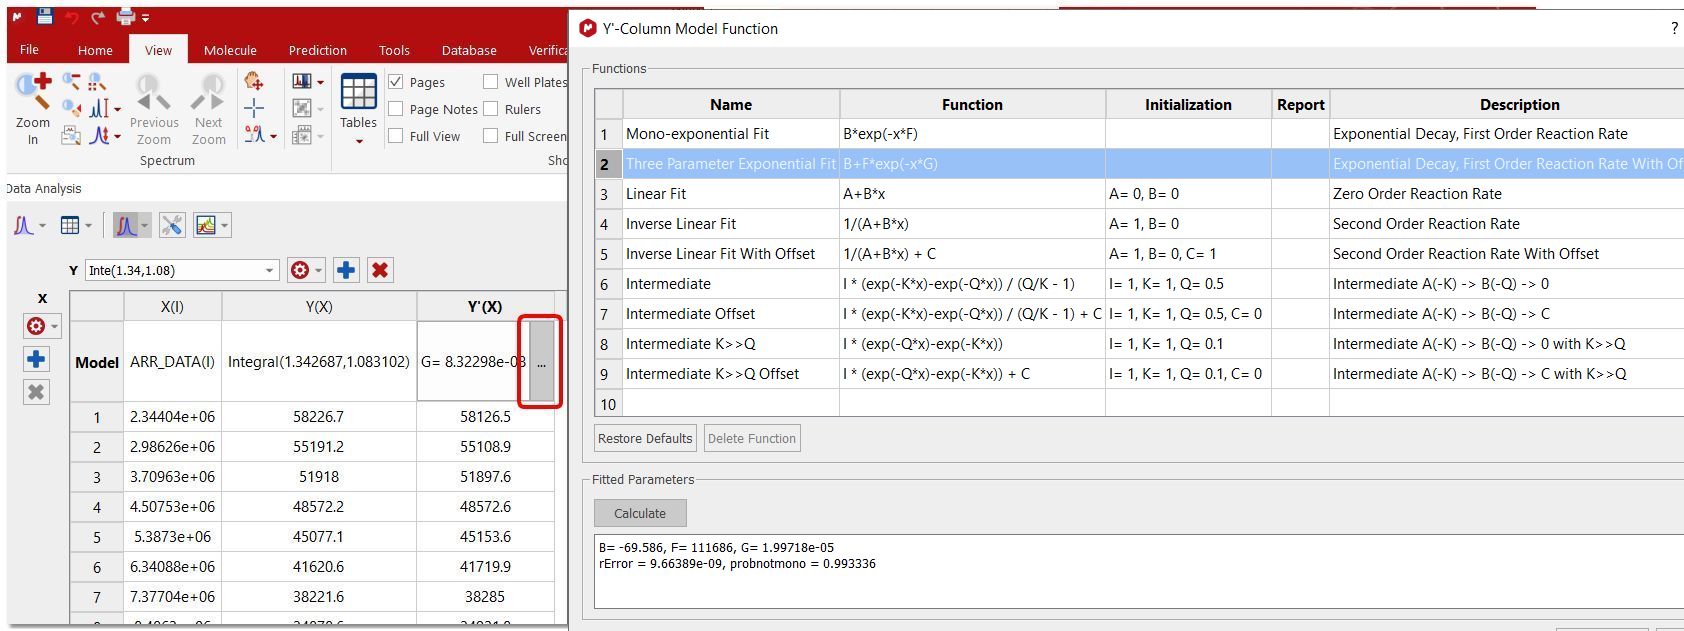
Clicking on the first cell of the column Y'(X) will allow you to fit the curve. In this case, we will fit it as a three parameter exponential curve.
Double click on the applicable cell to customize your NMR model by adding any other fitting formula. Here you can find a list of Mathematics javascript functions that you can use for your formulas (by using Math.sqrt(...) )
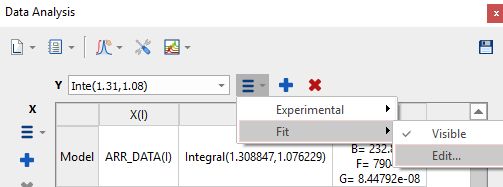
You can also select the 'Edit Fit' option below:
Next, click on the 'Calculate' button to generate the error and the parameters of the fitting and finally click on the OK button to draw the fitting curve.
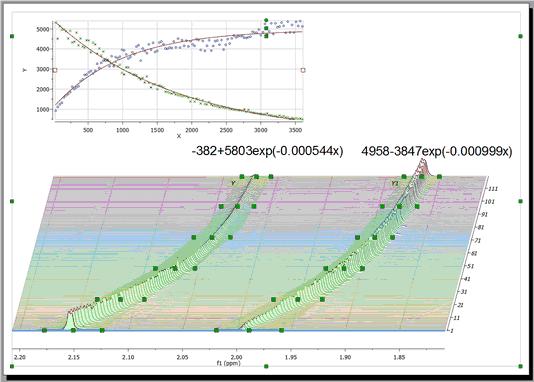
You can select other regions to be analyzed; each selected region will be colored differently (and the grab handle colors and graphical lines will have the same colors; which you can change by double clicking on the graph):
Follow the menu ' Data Analysis/Edit/Fit to Best' to allow Mnova to guess the order of the reaction (by fitting the data to standard equations and comparing the mean square error):
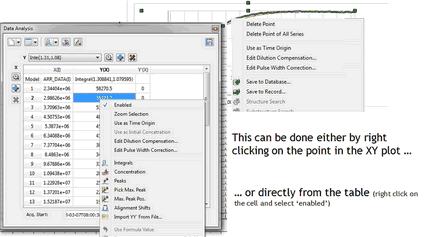
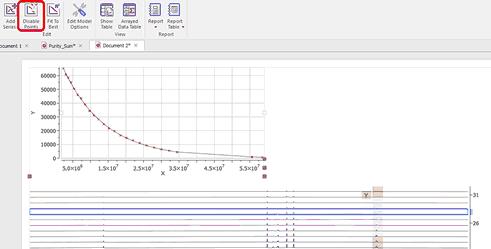
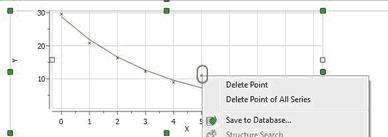
From the menu above, you will also be able to disable points (either directly from the XY graph or from the table):
You can also disable points directly from your arrayed dataset, just by clicking on this button
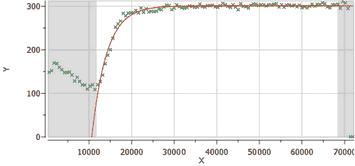
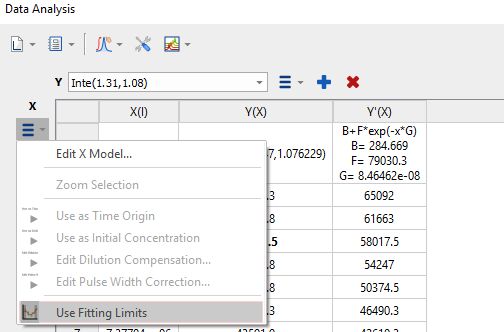
For convenience, you can exclude points from the left and right edges of the graph (by selecting 'Use Fitting Limits' on the Data analysis panel and highlighting the graph):
If you want to disable this option, just uncheck this button on the Data Analysis panel:
IMPORTANT: Every time a point is excluded, Mnova will dynamically recalculate the fitting function.
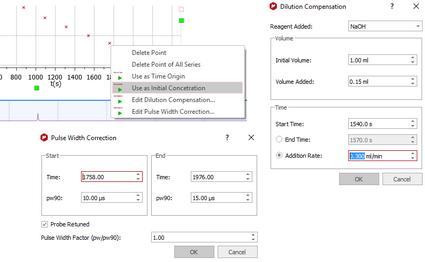
With the Reaction Monitoring plugin enabled, if you right click on any point of the Data Analysis Graph (or Table), you will be allowed to 'use that point as time origin', or to set the Dilution Compensation Parameters' and 'Pulse Width Correction':
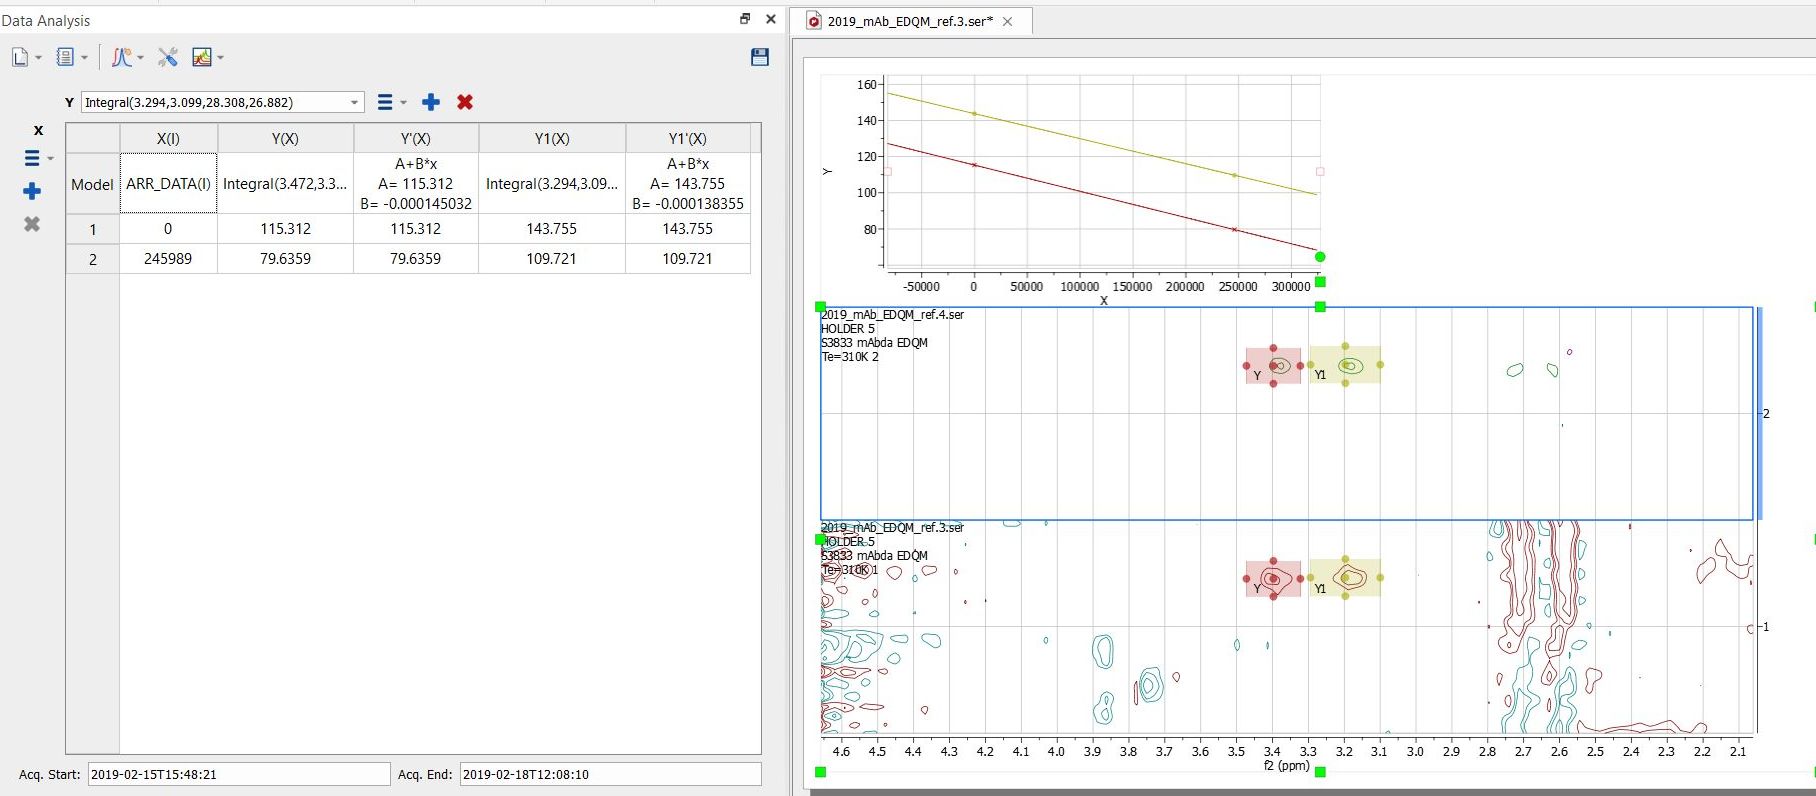
The Data Analysis feature can also be used with 2D stacked NMR plots:
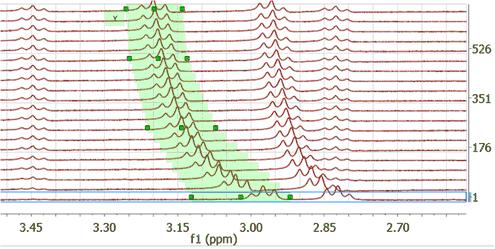
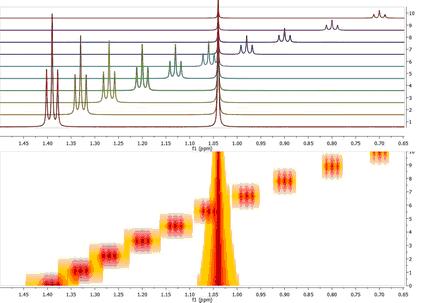
Crossing over of peaks Crossing over of peaks is a very common event in Reaction Monitoring (RM) experiments. When this happens, the automatic alignment algorithm might not work properly. To illustrate this issue, we have simulated using Mnova a very simple data set comprised by a triplet and a singlet in such a way that the chemical shift of the triplet moves from 1.4 ppm to 0.7 ppm and having an exponential decay from spectrum to spectrum. This is depicted in the figure below, both as a stacked and a bitmap plot:
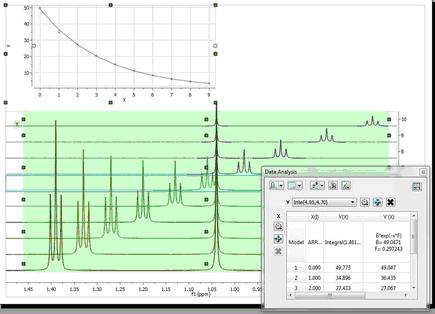
Now let’s say you are interested in extracting the intensities of the triplet as the reaction progresses. There is actually no need to pre-align the spectra algorithmically; it is much simpler to have some kind of graphical tool to instruct the software which peaks (or multiplets) need to be used for the reaction monitoring analysis. Let me show you how this works in Mnova: First of all, in the Data Analysis module you select the region to be analyzed. As a starting point, the region will have a rectangular shape (green rectangle in the figure below):
It can be noted that the graph shows an exponential decay, but the actual values must obviously be wrong as the values calculated, using the green rectangle as a boundary for the integration, include peaks from both the triplet and singlet, and we are interested in the analysis of the triplet resonances only.
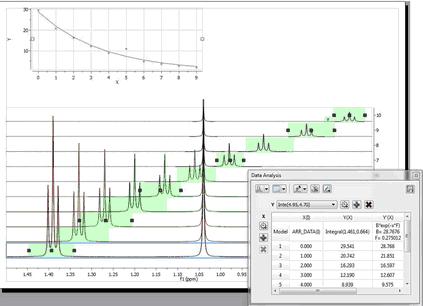
The selection rectangle has a number of handles (small green boxes). You can drag and move them freely so that you can adjust the selection feature to follow the triplet (the number of handles can be adjusted in the Data Analysis options. In the figure below, the result of adjusting the handles to follow the triplet is shown:
Now you can see that there is an outlier in the exponential curve which, obviously is caused by the singlet which overlaps with the triplet (spectrum number 6 which corresponds to data point #5, as in the graph the numbering starts from zero). Figure below shows that particular spectrum showing the singlet overlapping with the triplet:
At this stage, there are several approaches. The simplest one is to just discard that point for the analysis, for example, by right clicking on that point in the graph and disabling it:
As soon as that point is deleted / disabled, Mnova will update the graph automatically. This is the new result:
Another approach would involve using GSD to eliminate the singlet from the triplet so that it would not be necessary to discard the information from that particular spectrum.
Here you can watch a video about using Data Analysis for pKa calculation by NMR.
See this blog entry for the automatic peak tracking feature: http://mestrelab.com/blog/automatic-peak-tracking-in-arrayed-nmr-data/
You can also use the Data Analysis for stacked chromatograms. See this chapter for further information. |