Align Spectra


Align Spectra |
|
|
The chemical shift is of great importance for NMR spectroscopy because it reflects the chemical environment of the nuclides under observation providing detailed information about the structure of a molecule.
Although the chemical shift of a nucleus in a molecule is generally assumed to be fairly stable, there are a number of experimental factors (pH, salt concentration, solvent, field inhomogeneity –bad shimming, etc) which might produce slight or even quite significant variations in chemical shifts.
This is particularly important in metabonomics/metabolomics NMR where shifts of NMR peaks due to differences in pH and other physico-chemical interactions are quite common in NMR spectra of biological samples. For example, some important metabolites, such as citrate or taurine, have peaks whose chemical shifts fluctuate in an uncontrolled way from sample to sample. These variations can cause spurious grouping of samples in chemometric models.
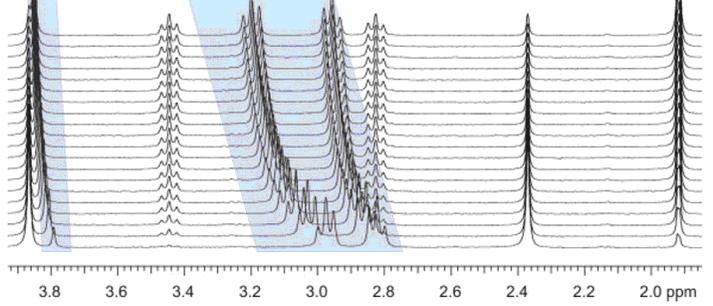
This problem is also very common in kinetics or reaction monitoring experiments by NMR. For example, consider the following reaction monitoring example:
It can be appreciated that during the course of the reaction, the chemical shifts of highlighted signals change as a result of the change in pH (in this case, as a hydrolysis proceeds).
Although characterizing these chemical shifts fluctuations can be sometimes important (pH or drug binding-induced chemical shifts, for example) in general they obscure the process of pattern recognition and impede the performance of data analysis (e.g. selection of the peaks whose intensities/heights need to be monitored can be more difficult).
Whilst it is critical to setup the experimental conditions in the best way to minimize these chemical shift fluctuations (for example by using an appropriate buffer); spectral misalignments may still occur and special post-processing methods have to be employed.
In order to cope with this misalignment issue, Mnova includes several methods, namely:
•Manual (semi-automatic) global spectral referencing •Fully automatic global spectral referencing •Spectral alignment (including global and regional-wise spectral alignment)
The first two methods can be regarded as simple, global methods for peak alignment as they shift the entire spectrum by some constant amount, whilst the third method is much more sophisticated making possible both the global and local alignment of different spectral regions
These three methods are explained below:
1) Manual (semi-automatic) spectral referencing This method corresponds to the well-known chemical shift referencing method in which the user sets the internal reference peak (e.g. TMS, DSS, TSP etc) of each spectrum to e.g. 0 ppm. The particularity of Mnova is that it contains an auto-tuning parameter which makes it possible the automatic referencing of many spectra by simply seeking for the highest peak within a narrow (user-defined) interval.
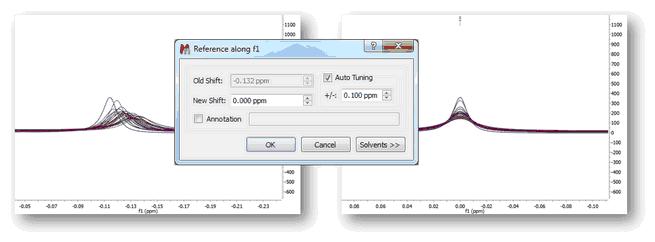
The figure below (left) shows 26 superimposed misaligned peaks. Manual Referencing using an auto-tune parameter of 0.1 ppm yields the result depicted in the figure on the right:
Clearly, this method will not work properly in those data sets with local misalignments, that is, when signals of one metabolite fluctuates in one direction whilst the peaks of a different metabolite move differently). As an example, let’s consider a simulated data set of Taurine:
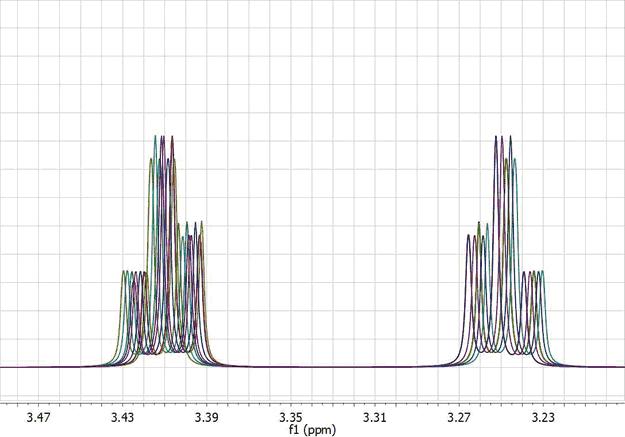
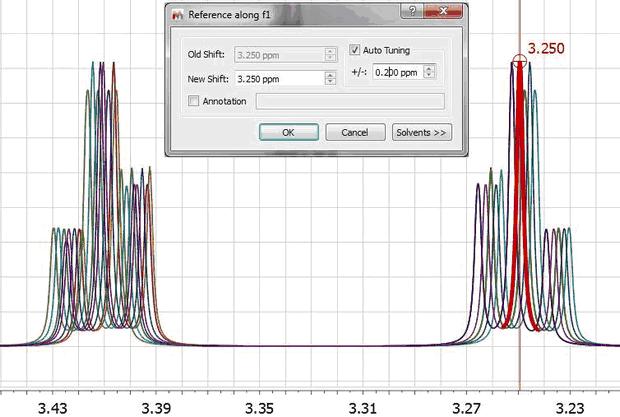
This data set has been generated by randomly changing the chemical shifts of the two CH2 groups. Now, let’s apply the global alignment procedure using as chemical shift reference at a value of 3.25 ppm as shown in the picture below:
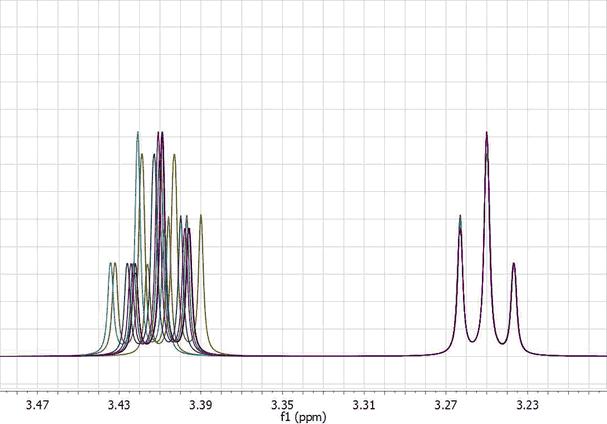
As expected, all peaks corresponding to the triplet at 3.25 get perfectly aligned, but the other multiplet remains misaligned:
One could devise an extension to this global alignment procedure in which the same procedure is applied to different segments of the spectrum. In this particular case, one could select two different windows, one for each triplet and apply the same algorithm locally to each segment. However, having to manually select the chemical shift reference for each segment is not very practical and, in addition, relying only on the simple search of the maximum peak within each segment is not a very robust method for automatic alignment.
2) Fully automatic global spectral referencing In the previous method, the user needs to select a peak as a reference for the alignment process, together with the window width for the auto-tuning parameter. Mnova provides an alternative, fully automatic method which aligns, globally, all spectra in a stack. This method uses one spectrum as a reference (the active spectrum) and then aligns all remaining spectra by maximizing the cross-correlation between the reference spectrum and the spectra to be aligned:
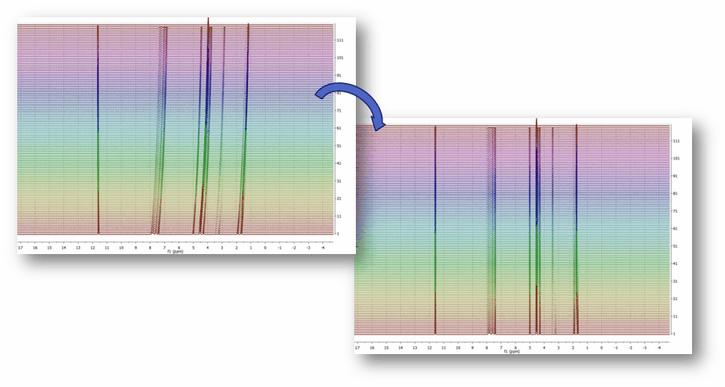
3) Spectral alignment (including global and regional-wise spectral alignment) The magnitude of misalignments within a single sample may be nonlinear, making it challenging to apply a simple alignment correction across an entire spectrum.
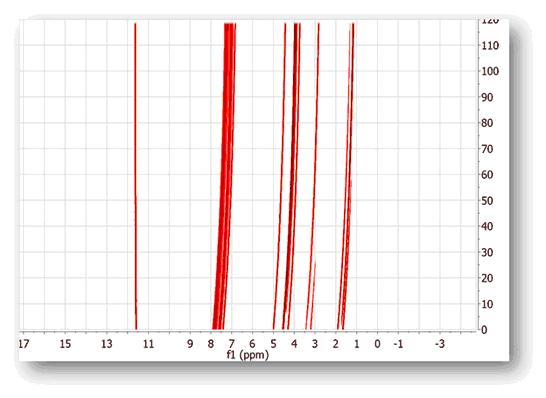
An example of this nonlinear misalignment is shown in the spectrum below (intensity map or bitmap plotting mode). It can be noticed that the peaks at about ca 11.6 ppm do not move whilst the peaks at higher field move very significantly. It’s evident that correcting the data using a single reference peak (or a global shift) is not sufficient:
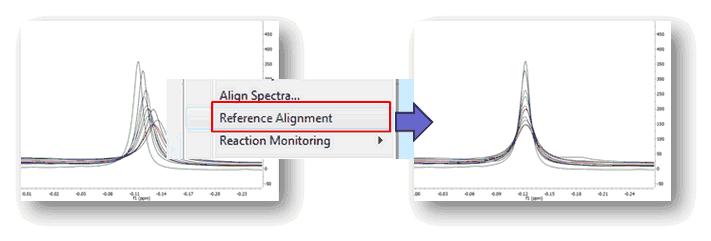
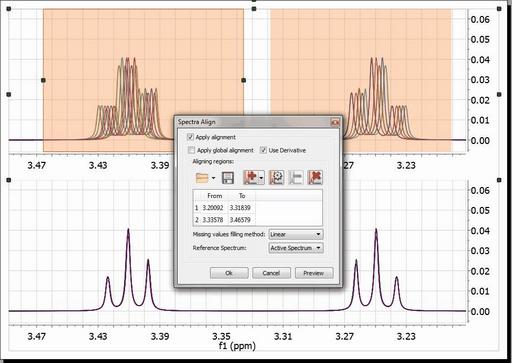
Resorting back to the synthetic data set used in the previous section, let´s see a semi-automatic method designed specifically to align spectra having local chemical shift variations. From a practical point of view, the user needs to select the spectral regions to be aligned and then the program will automatically align those regions separately The picture below shows the spectrum before alignment and the two selected regions (top) and the result obtained after applying the alignment algorithm (bottom):
Mnova provides a powerful and flexible approach to dealing with misalignments based on a segment-wise peak alignment with the option to apply a global alignment as a pre-processing stage. The algorithm allows the user to select the boundary locations using an interactive display, but the process is also amenable to automation.
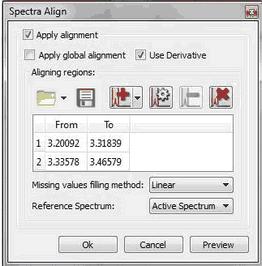
The 'Missing values filling method' option is applied when you have ‘Aligning Regions’ in order to reconstruct those parts of the spectra that are shifted when you apply the alignment. The default method is Linear and there seems to give good results, but ‘Ending Values’ and ‘Keep old data’ also work fine. The ‘zeroes’ method is filling the holes with zeroes.
Use the applicable buttons to load and save alignment regions in XML format.
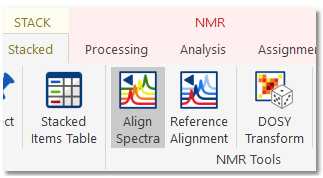
We have improved the traditional cross-correlation algorithm by working on the first derivative domain calculated using an improved Savtizky-Golay routine in which the order of the smoothing polynomial is automatically calculated. The idea is to minimize potential problems caused by baseline distortions or very broad peaks. We have found this method to be very useful not only in the context of metabonomics, but also in the alignment of Reaction Monitoring data sets. This comprehensive spectral alignment toolkit is available in Mnova in the 'Stacked' menu. It can work on the entire spectrum (Global Alignment) as well as on intervals of arbitrary length in sequence. Based on these options, different strategies can be employed.
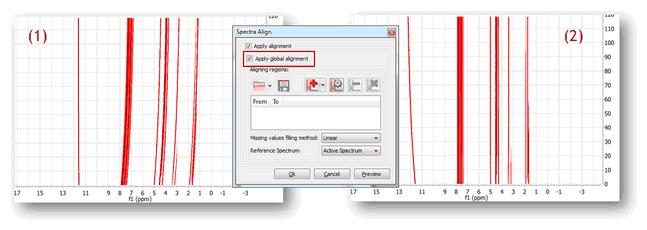
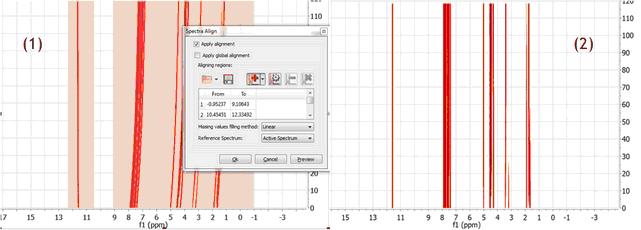
Two examples (strategies) will be shown below: Strategy 1 Starting with raw spectrum (1), to perform a full-spectrum correction before the single intervals are aligned
It can be appreciated that after applying the global alignment, most of the peaks in (2) are now properly aligned, except the peaks at the left which were previously aligned but after this operation get misaligned. This problem will be cured in the next step.
Strategy 2 A different, although analogous strategy, would consist in aligning two different spectral intervals separately without resorting to a global alignment as shown in (1). Note that the peaks in the interval in the left are already well aligned.
Figure (2) shows the final result after the two interval have been aligned. It’s completely equivalent to the result obtained with Strategy 1
|