Stacked Options and Properties


Stacked Options and Properties |
|
|
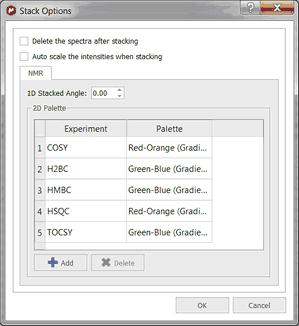
Options By default Mnova will delete the 1D spectra after having stacked them without autoscaling them. If you want to modify these defaults, you will need to follow the menu 'Stack/Stack Options' and uncheck the applicable box. From here, you will be able to change also the stacked angle and to select different palettes for your superimposed 2D experiments.
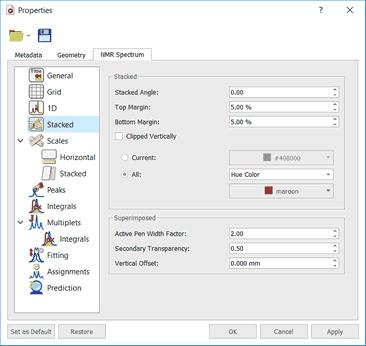
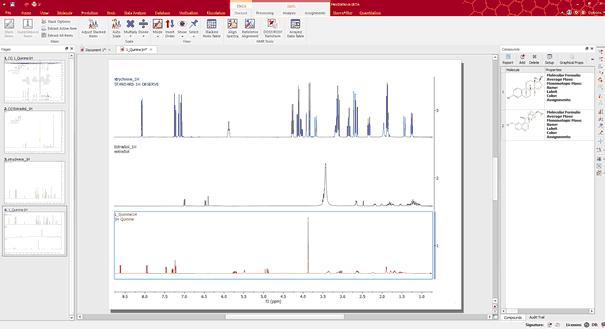
Properties The user can change the Stacked Items properties by double clicking on the spectrum window; this will display the Properties dialog box, where the user can modify the Style (lines, crosses or circles), the Line Width, the Stacking Angle and the color of the current slice as well as that of the spectrum (single color, gradient or hue color). From here you can change the colour of the background or show the title of the spectrum and the title of each slide of the stacked plot, by checking the corresponding boxes:
You can change the top and bottom margins of the stack plot, which is really useful in to avoid clipping a stacked plot at the spectrum border. With this property you will be able to adjust the distance between the top of the spectrum object and the baseline of the uppermost spectrum.
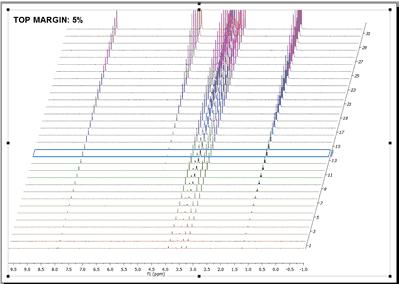
Here you can see an example with a top margin of 5%:
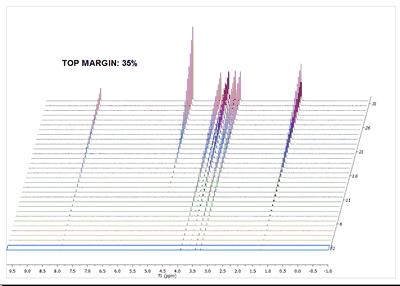
And the applicable result after having selected a top margin of 35%:
You can cut off the peaks to avoid overlapping just by checking the 'Clipped Vertically' option:
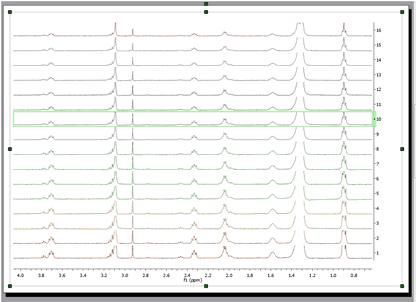
Here you can see an example of a stacked plot with the title of the different traces:
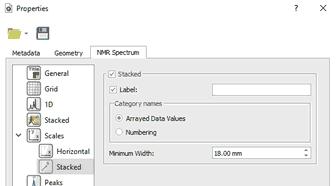
For metabolomics studies it is important to superimpose multiple spectra and compare their shape, e.g. to identify which ones are outliers. In such a mode, when the user sets a spectrum as the Active spectrum, that spectral curve will be displayed with a thicker curve. Follow the 'Home/Properties/Stack' menu to customize the 'Active pen width factor' (2.00 by default) and 'Secondary Transparency'. Selecting 'Scales' in the left-vertical tabbed menu, will allow you to change the color of the scale, the font, add labels and also show/hide the horizontal and the stacked axes. From the Stacked menu, you can also change the label and the content (arrayed data or just numbers) of the stacked scale or the minimum width of the scale.
|