1D NMR Processing Tour


1D NMR Processing Tour |
|
|
Opening the data set
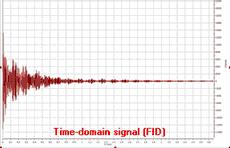
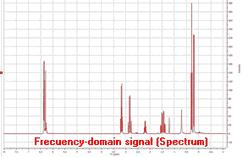
In pulsed NMR spectroscopy we obtain what is called a time-domain signal since the measured signal is a function of time; all the nuclear resonances decay from the same starting time to form the Free Induction Decay or FID. This kind of signal is not readily interpretable by the human eye, and so it is necessary to transform it (into the frequency domain) using a Fourier transformation (FT) to display the separate nuclear resonances as a frequency spectrum.
There is one single command for opening all types of files in Mnova. It is not necessary for the user to have any knowledge about the way in which the experiment has been acquired. Mnova will automatically recognize most common spectrometer file formats and acquisition modes and will apply the necessary processing operations.
To open your data (including mol files and graphics files), just go to 'File/Open' menu, use the keyboard shortcut <Ctrl+O> (or Cmd+O for Mac) or click on the 'Open' icon on the toolbar (note that this is exactly the same for 1D and 2D data). You can also drag&drop into Mnova, the folder containing the FID (the FID must be in the first level of folders)
Once this command has been issued, navigate through your disk to find the NMR experiment of interest and select the desired FID file which is normally named fid; however in Bruker 2D experiments the time domain data is named ser (serial fid). After selecting this file, the first thing you will notice is that the spectrum will open already processed, despite the fact that you are opening raw data (FID). When opening files, Mnova will apply the necessary processing operations, selecting the correct processing parameters from the spectrometer files. If these parameters are not available (e.g. phase parameters are not available), Mnova will use automatic algorithms (e.g. automatic phase correction) and will apply them to the data set. Thus, even a completely inexperienced chemist, working with NMR for the first time, should be able to get good results when processing both 1D and 2D spectra.
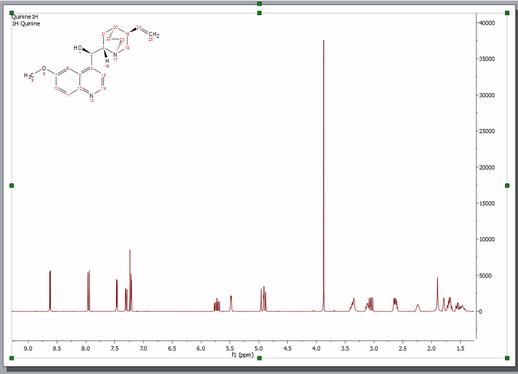
In the figure below you will see what happens when the FID is opened:
As explained above, the FID is automatically processed. In this case, the native files contained values for phase correction and thus Mnova utilized them for phasing. However, as you can appreciate, the result is not good enough (most likely because the spectrum was processed in the spectrometer computer using an inefficient automatic phase correction algorithm). Later we will show how to improve the phase of this spectrum by applying first the automatic phase correction algorithm implemented in Mnova and finally using manual phase correction. Remember that if the native files do not contain values for phase correction, Mnova will apply an automatic phase correction.
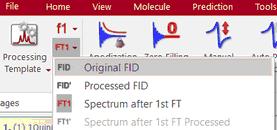
Even though you have opened a FID and you see only the processed spectrum in Mnova, you can see the original FID and the processed FID (Processed FID or FID'). When we process the raw data on-the-fly, we do not discard these data, we just do not display them. The user can view the FID by just clicking on the 'FID' icon on the toolbar:
There are several options in the scroll down menu:
•Original FID: Clicking on this option will show the original time-domain signal (FID) as it was when ported from the spectrometer. •Processed FID: Clicking on this option will show the FID after time-domain processing functions have been applied (i.e., immediately prior to FT) •FT1: Clicking on this option will show the data after FT along the direct dimension (spectrum for 1D data, interferogram in 2D data) •FT1': it will display the processed fid before the second FT (in t1): •FT2: Clicking on this option will show the data after FT along two dimensions (2D spectrum)
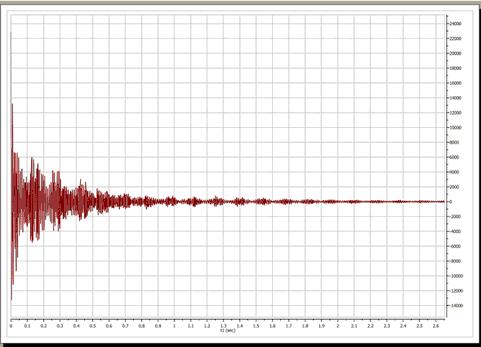
For example, this is the original FID of our test spectrum:
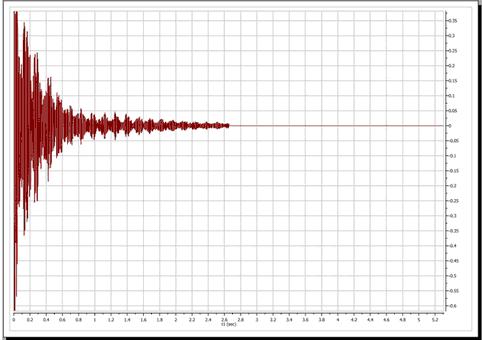
And this is the so-called FID'. In this case, prior to FT, Mnova applies a zero filling operation as can be appreciated in the FID' below. A zero fill increases the digital resolution by adding null data to the FID, increasing the size of the data array.
You can switch at any time between any of the displays (FID, FID' and processed spectrum).
Interactive Processing: Real Time Frequency Domain Processing
As we saw in the previous section, Mnova will keep all pre, during and post processing information together with the spectrum we can see on the screen. This fact, combined with the extremely fast and optimized processing algorithms implemented in Mnova, allows us to introduce to NMR processing the concept of 'Real Time Frequency Domain Processing', designed to greatly simplify processing for the user and to ensure faster and better results even when complicated operations are applied to the data.
The way this concept works is very simple: Reprocessing of the spectrum is possible at any time, independently of the time domain and frequency domain operations which may have been applied to the data set (for example, to change the window function after having applied a FT, phase and baseline correction). This is possible because, in the background, Mnova is going back to the FID and reprocessing the spectrum by applying the new functions or parameters as well as all the other functions applied ad posteriori on the previous processing. The very important advantage for the user is that he can see, in real time, the effect of any processing operation (including time domain operations) on the resulting frequency domain spectrum (for example, you can apply a more drastic exponential apodization function and see in real time, on screen, what effect this is having on the resolution and sensitivity of the frequency domain spectrum).
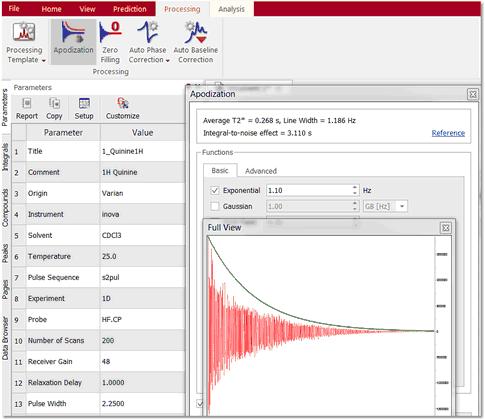
In the figure below, you can see the frequency domain 1D spectrum, the FID with the window function which is being applied interactively (which is shown graphically in the 'Full View' window (go to the 'View/Full View' menu to activate), and also the Apodization dialog box - note that the 'Interactive' box is ticked). The user can follow the exact effect of the function s/he is applying on the frequency domain spectrum. This can avoid repeated transformation and reloading of the data while the optimum processing parameters are sought and, of course, act as an excellent teaching and self-teaching tool for those who are not conversant with the effects of different processing parameters.
This same principle can be applied to all other processing operations, such as Zero Filling, Linear Prediction, Signal Suppression, etc. For example, if we want to increase the digital resolution of the spectrum, we can increase the number of points used in the FT operation by selecting Zero Filling.
Of course, standard frequency domain operations such as phase correction or baseline correction can be applied in the traditional way.
See also: |