Phase Correction with Mnova


Phase Correction with Mnova |
|
|
NMR spectra are usually represented in absorption mode, which offers a greater resolution and proportionality between the integral of peaks and the number of nuclei which cause the signal, in comparison with other representations such as dispersion mode, magnitude or power of the spectrum. Nevertheless, the absorption and dispersion curves are often mixed, giving rise to curves which lose the original symmetry. This problem, combined with other deficiencies, such as delays between the initial pulse and the beginning of data acquisition, cause a phase shift which varies linearly with frequency. This phase errors can be easily rectified in software by applying a lineal combination of the real and imaginary components of the spectrum in order to obtain pure phase lineshapes. This correction is composed by a frequency independent parameter, or zero phase correction (α) and a first order phase correction (β) or linear dependent on the frequency parameter:
where k = 0,.....,N-1; Rek and Imk are the real and imaginary components of the data points (k), Re'k and Im'k are the new components after correction and N is the total number of points.
Mnova implements both manual and automatic Phase Correction algorithms.
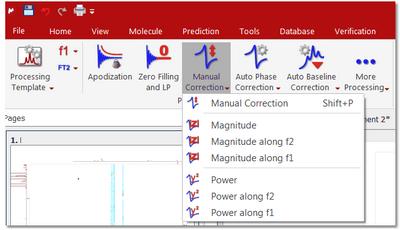
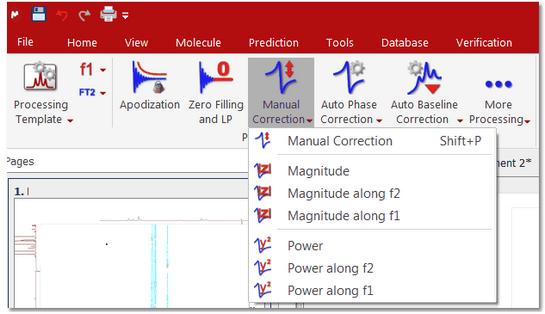
The Phase Correction scroll menu is located on the Processing ribbon:
The software implements three algorithms for automatic phase correction, which can be applied both to 1D or to 2D data sets, and a manual algorithm, which allows for very easy, eye driven, real time zero order and first order phase correction. Once the user selects a Phase Correction method, Mnova will store it for future uses, highlighted with a black square.
Automatic Phase Correction
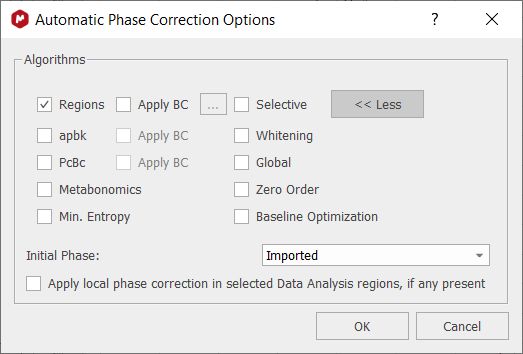
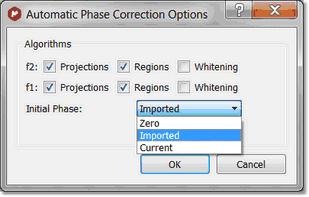
Mnova gives the user the choice between several auto-phasing algorithms for higher flexibility. Indeed you can select more than one algorithm at the same time and the algorithms will be applied consecutively:
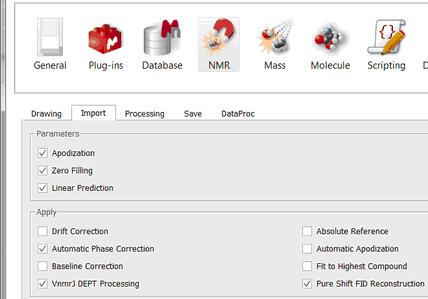
The user will be able to select the initial phase correction to run the Automatic Phase Correction algorithm (Zero,Imported, Current). By default is the imported phase from the spectrometer (you can change the default Phase Correction from the 'File/Preferences/NMR/Import' menu):
Regions Analysis: An autophasing routine which uses complex fit with phase on the peak regions.
Selective Method (Not available in Mnova Lite): This automatic method is intended for spectra containing negative and positive peaks (e.g. DEPT, APT, etc) or in the presence of baseline distortions. Mnova creates a list of the highest peaks in the spectrum and then uses symmetrization criteria to obtain the optimal phasing parameters (α and β).
Mnova will automatically execute the better Phase Correction in each case prior FT.
apbk: algorithm for 1H Bruker NMR datasets, with the capability to apply a baseline correction. It requires to have a Java virtual machine installed.
Whitening: A method for fully automated phasing of Fourier transform NMR spectra based on a combination of the whitening and the metabonomics method. First of all, the whitening method is applied in order to get good starting phase correction parameters even in spectra that have both positive and negative peaks. Then the most negative peaks are removed and a simple baseline correction is applied. Finally, the metabonomics method is applied.
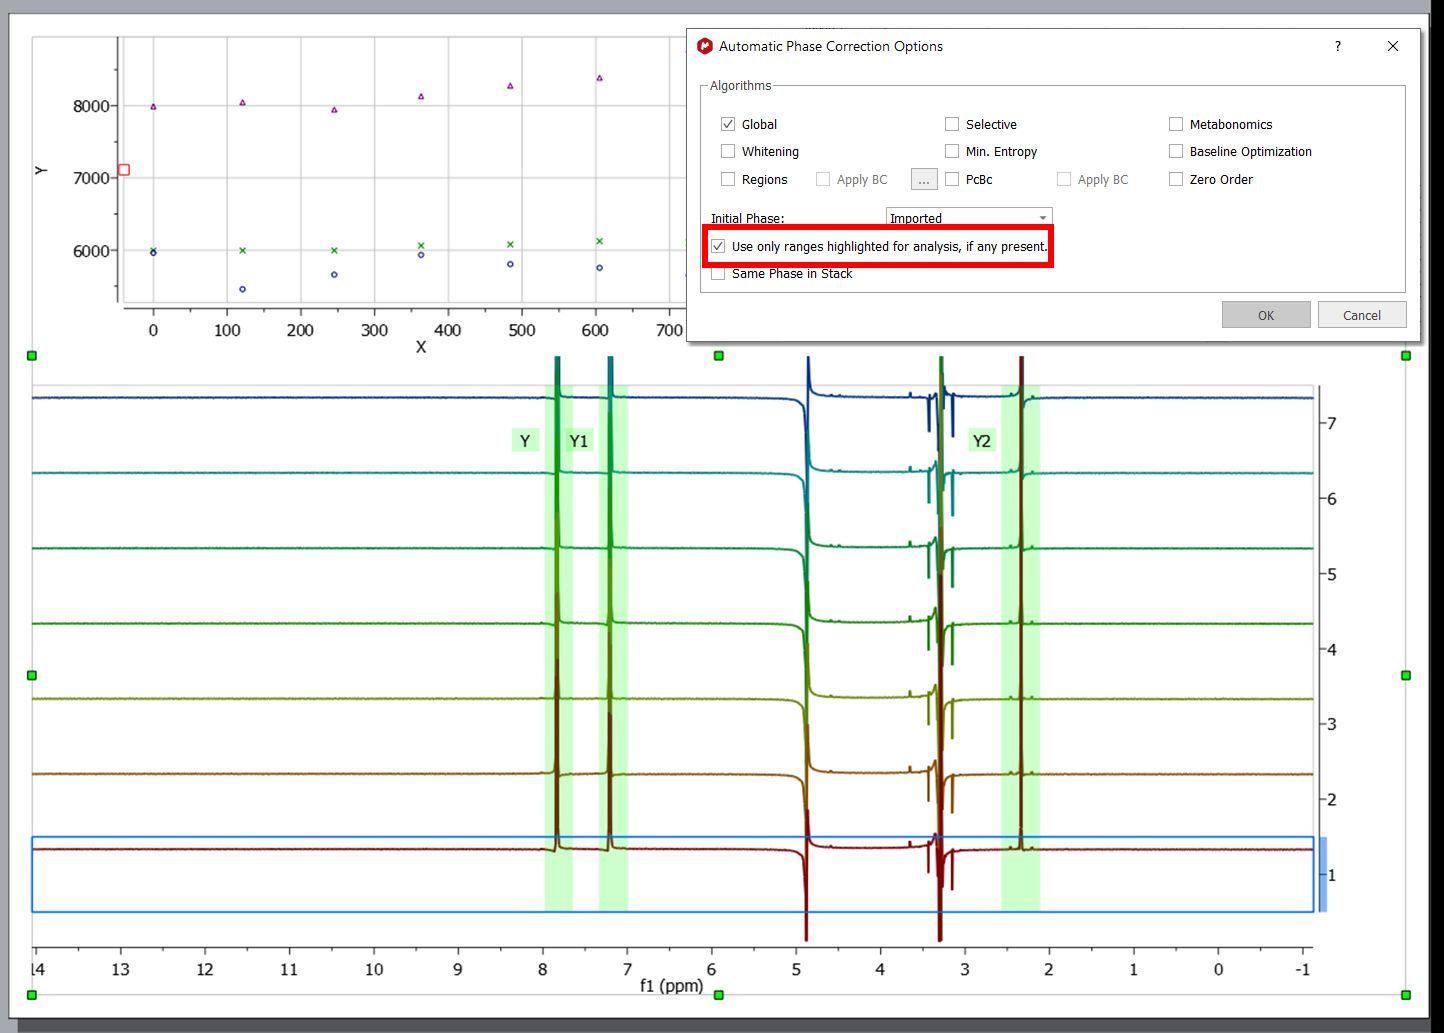
If you are working with the Data Analysis feature in stacked plots, you can check the option "use only regions highlighted for analysis" to extract values only from the selected regions to be used by the phase correction algorithms. Please note that the final Phase correction will be applied to the entire spectrum. So for example, if the user has selected 3 regions in a spectrum for data analysis, auto phase correction will exclusively use those 3 regions to apply the phase correction to the entire spectrum.
PcBc: only available for 1D, it will allow the user to apply a phase and baseline correction at the same time.
Global method: This method automatically finds phasing parameters (α and β or PH0 and PH1) using an iterative process in which the intensity of the lowest point in the spectrum is optimized. This method is not appropriate for experiments like DEPT or APT, where we can find both positive and negative peaks, but is highly efficient for most 1H spectra. However, it is sensitive to bad baselines and low Signal/Noise ratios. Mnova will automatically execute this Phase Correction.
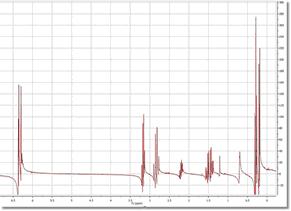
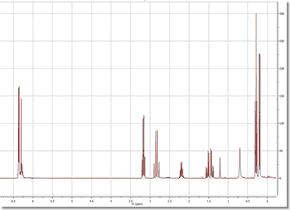
You can see below the effect of an automatic phase correction on a 1H-NMR spectrum with a very bad phase:
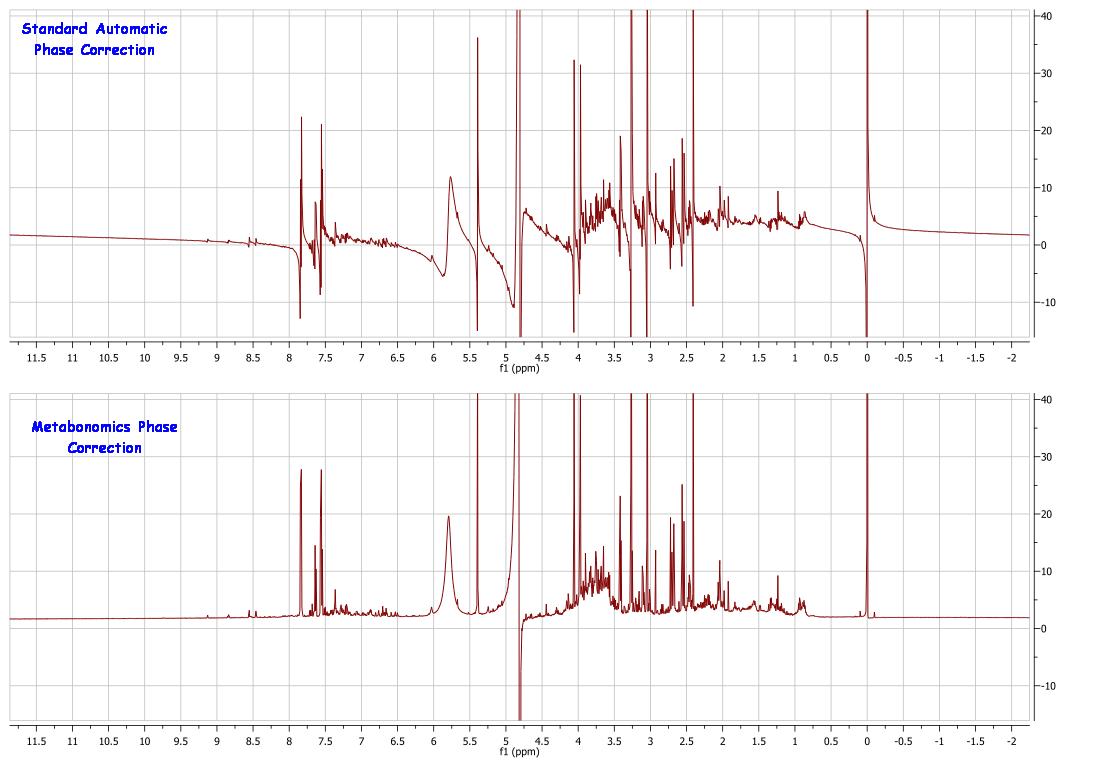
Metabonomics. A new Automatic phase correction algorithm optimized for biofluid-like spectra (Not available in Mnova Lite).
This algorithm is an extension of the standard automatic phase correction algorithm optimized to deal with Metabonomics-like spectra in which most of the signals are concentrated towards the center of the spectral width. In addition, it can also efficiently deal with situations in which a dispersive peak is present in the center of the spectrum, as is usually the case with water in urine samples. It is also tolerant to small first order baseline distortions (including V-shaped baselines).
The figure below shows a spectrum of rat urine with the standard automatic phase correction algorithm applied to the top spectrum and with the new automatic phase correction algorithm applied to the bottom spectrum.
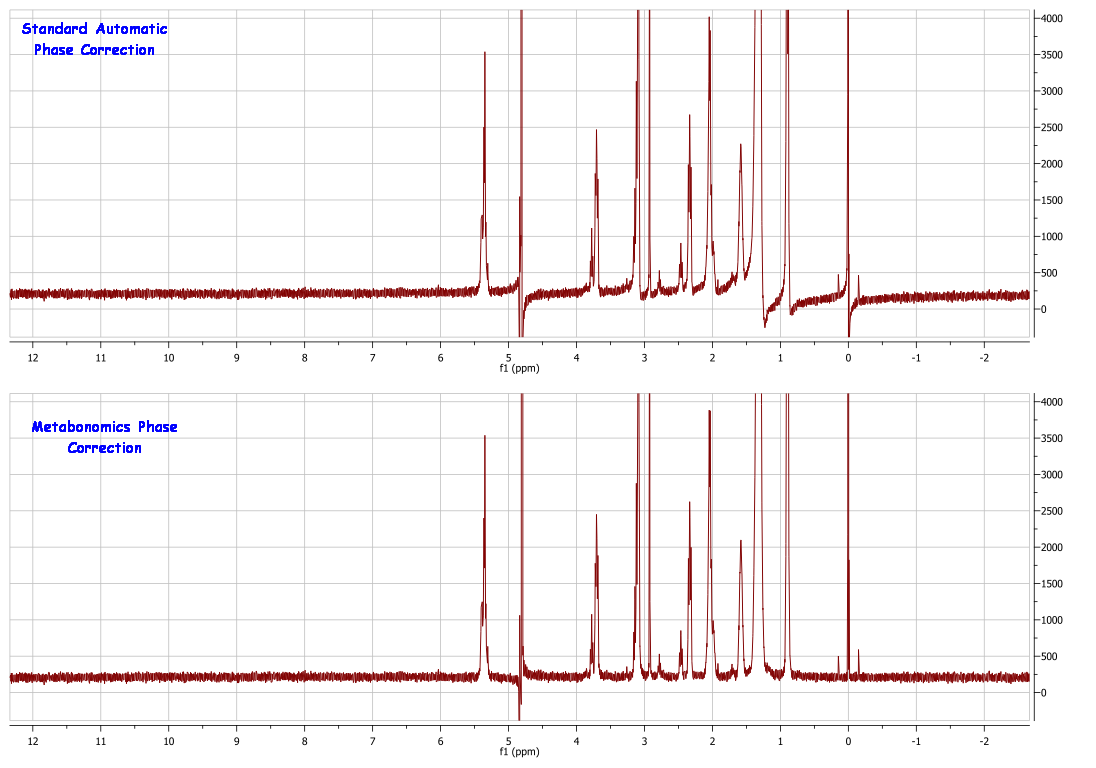
This algorithm is not restricted to Metabonomics spectra, as it is also good for any other spectra satisfying the two conditions outlined above. For example, the figure below shows the difference in performance between the standard automatic phase correction algorithm (top) and the new one (bottom). In this case, the water signal cannot be perfectly phased and thus a standard automatic phase correction fails. The new method yields a much better result as can be seen in the figure.
Zero Order: allows to make an automatic phase correction in PH1 with a zero value. Please note that the auto-phase correction is performed by running the selected algorithms one by one in a predefined order. The Zero Order phase correction is the last algorithm, so, even if it doesn't modify the PH1, all the other algorithms do (they adjust both phases, PH0 and PH1, together). Therefore, if you select also other algorithms different to Zero Order when running Phase Correction, these algorithms (Global, Whitening, etc.) will change PH0 and PH1, and then, the Zero Order algorithm will just adjust again the resulting PH0.
Min. entropy: An algorithm for automatic phase correction of NMR spectra based on entropy minimization. See this paper for further info
Baseline optimization: A method for fully automated phasing of Fourier transform NMR spectra based on a baseline optimization technique. See this paper for further info.
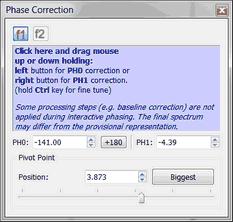
Manual Phase Correction (shortcut: Shift+P) The manual phase correction is based in finding the appropriate α and β phase correction parameters. This option is very easy to use. Just select 'Manual Correction'.
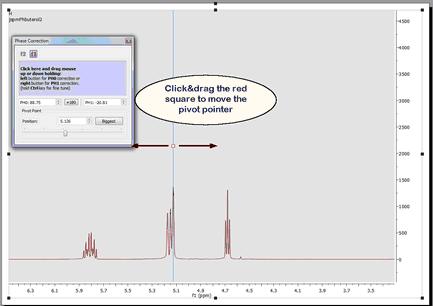
Once the dialog box is open, establish a pivot for the adjustment by just using the scrolling bar provided. The pivot will maintain an invariable phase in the peak where it is located, while a first order correction is carried out. Click on the Biggest button to put the pivot point on the biggest peak of the currently displayed spectrum region. You can also place it in a position of your choosing by clicking and dragging the pivot point marker or by selecting the desired position in the edit box: Next, correct the zero order phase (by clicking with the left mouse button anywhere on the Phase Correction dialog box and dragging the mouse up or down without releasing to correct the phase of the reference peak) and finally do exactly the same whilst right clicking to correct the phase of the remaining peaks (First Order Phase Correction). For a fine tuning, hold the 'Ctrl' (or cmd key in Mac) key while dragging the mouse. You can use the 'Ctrl' key in a Mac machine to simulate the right mouse button in order to phase PH1. The Phase Correction dialog box incorporates two edit boxes to introduce the values of α (PH0) and (PH1) β for the correction and a button to apply +180º to PH0
The power and speed of the manual phase correction algorithm implemented in Mnova becomes obvious when correcting the phase of 2D experiments. This can be done directly on the 2D matrix, and the phase can be quickly corrected along one and then the other dimension (Note that for all operations in 2D NMR, the active dimension is indicated by the 'f1' and 'f2' icons in the upper toolbar).
Phase Correction for 2D-NMR spectra
The phase correction feature for 2D NMR spectra includes powerful algorithms which can be accessed via the 'Auto phase correction scroll down' menu. Clicking on 'Options' will display a dialog box which will allow you to select the desired algorithm:
The Projections algorithm will calculate the 1D projections of the 2D-NMR spectrum and will apply a 1D automatic phase correction over both projections. These values will be used as initial values for the 2D adjustment when you have selected also the Whitening algorithm. If you only select the Projections algorithm, only 1D phase corrections values (of the projections) will be used for the 2D correction. This method involves the calculation of the internal projection as the sum of all columns (or rows) in the 2D matrix. In the case of homonuclear correlation spectra, the projection is analogous to the diagonal. The phase correction calculated by an automatic 1D algorithm can be used as a rough estimate of the phase correction of the whole 2D matrix. This method is satisfactory in the case of homonuclear correlation, but inapplicable in the case of an edited HSQC (with both positive and negative peaks and much more noise). Regions: the phasing in each direction is applied on slices, selected by peak picking. All phases are combined for a single linear regression analysis per each dimension. The Whitening algorithm is based on the whitening concept formulated as the ‘maximization of the number of white pixels into a bitmap that corresponds to the spectrum’. This process of maximization can be factorized along the individual axes of the spectrum and this property makes the method robust and fast. It employs a statistic measure based on a large number of spectral data points and, for this reason, is very tolerant to low SNR and local artifacts. The algorithm can efficiently phase either homonuclear or heteronuclear experiments and, unlike other previous methods, it can also process automatically spectra containing positive or negative peaks so that it is not necessary to deal with individual or special cases. NOTE: After having applied a baseline correction in a 2D dataset, the manual phasing will be grayed out. To undo the baseline correction, follow the menu "Processing/Processing Template' and turn off the Baseline Correction for either dimension, click on OK and you will be able to correct the phase manually. Alternatives to Phase Correction. Magnitude and Power.
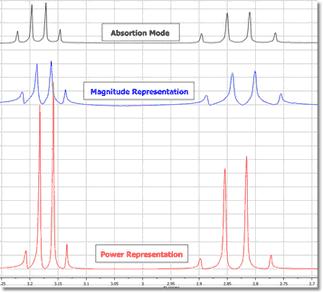
There are other easier alternatives if you only need positive peaks: representations in 'Magnitude' or in 'Power'.
Magnitude: It determines the representation of the final spectrum. If this option is checked you will see the absolute part of the spectrum; if it is unchecked you will only see the real part. As a spectrum is composed of complex vectors, its magnitude or module M can be calculated by the following expression:
To represent the spectrum in Magnitude with Mnova, just select Magnitude under the 'Manual Correction' scroll down menu:
Mnova will replace the real part of the spectrum by the magnitude (M) of each complex vector and the imaginary one by the phase angle of the vector ϕ, thus allowing reversal of this option. That is to say:
Power: the power of the spectrum (P) is defined as the square of the magnitude:
To represent the power of the spectrum, select 'Power' under the 'Manual Correction' scroll down menu . The 'Power' as well as the representation of the 'Magnitude' are reversible options.
The 'Magnitude' representation produces an increase in linewidth, whilst the 'Power' representation distorts the intensities of the peaks:
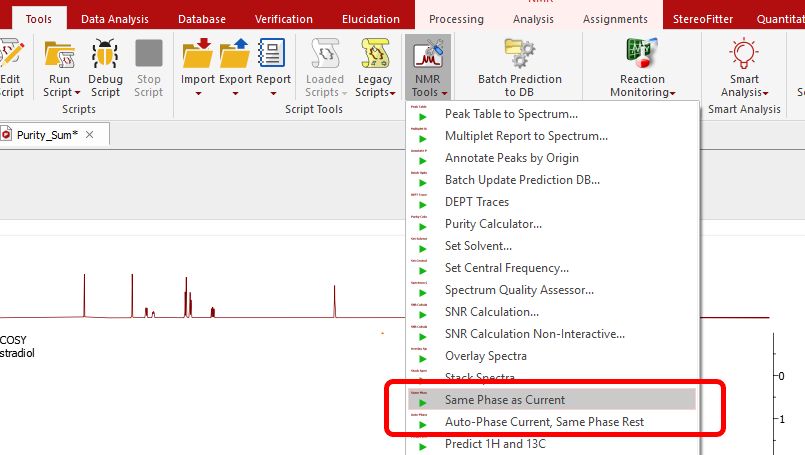
Scripts to autophase importing autophase stacked spectra when importing. Following the menu 'Tools/NMR Tools', you will find a couple of scripts to apply automatic phase correction to a stacked plot:
•Auto-Phase Current, Same Phase Rest: the active spectrum is automatically phase corrected, and the resulting values of PH0 and PH1 are applied to the other spectra in the stacked. •Same Phase as Current: PH0 and PH1 values of the active spectrum are applied to the other spectra in the stacked. |