打开数据集
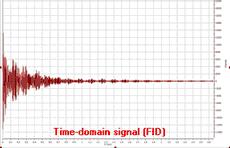
在脉冲 NMR 波谱中,我们获得的是所谓的时域信号,因为测量信号是时间的函数;所有核共振从相同的起始时间开始衰减,形成自由感应衰减或 FID。人眼无法轻易解读这种信号,因此有必要使用傅立叶变换 (FT) 将其转换(转换到频域),以频谱的形式显示单独的核共振。
在Mnova 中,只有一条命令可以打开所有类型的文件。用户无需了解实验的采集方式。Mnova会自动识别最常见的波谱仪文件格式和采集模式,并进行必要的处理操作。
要打开数据(包括 mol 文件和图形文件),只需进入"File/Open(文件/打开)"菜单,使用键盘快捷键<Ctrl+O>(或 Mac 的 Cmd+O)或点击工具栏上的"Open(打开)"图标(注意,这对一维和二维数据完全相同)。您也可以将 FID 拖放到 Mnova 文件夹中(FID 必须在第一层文件夹中)。
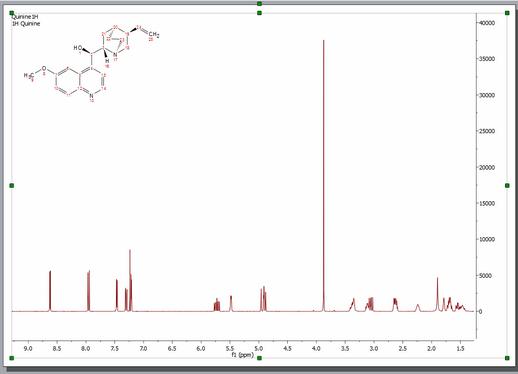
发出该命令后,在磁盘中找到感兴趣的 NMR 实验,并选择所需的 FID 文件,该文件通常命名为fid;但在布鲁克公司的二维实验中,时域数据命名为 ser(序列 FID)。 选择该文件后,您将注意到的第一件事是,尽管您打开的是原始数据(FID),但打开的频谱已经经过处理。打开文件时,Mnova 会应用必要的处理操作,从波谱仪文件中选择正确的处理参数。如果这些参数不可用(如相位参数不可用),Mnova 将使用自动算法(如自动相位校正)并将其应用于数据集。因此,即使是完全没有经验的化学家,在第一次使用 NMR 时,也能在处理一维和二维波谱时获得良好的结果。
在下图中,您将看到打开 FID 时发生的情况:
如上所述,FID 是自动处理的。在本例中,原始文件中包含了相位校正值,因此 Mnova 将其用于相位校正。然而,正如您所看到的,结果并不理想(很可能是因为波谱仪计算机在处理波谱时使用了低效的自动相位校正算法)。稍后我们将展示如何通过首先应用 Mnova 实现的自动相位校正算法,最后使用手动相位校正来改进该波谱的相位。请记住,如果原始文件不包含相位校正值,Mnova 将应用自动相位校正。
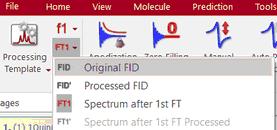
即使您打开了 FID,在 Mnova 中也只能看到处理后的波谱,您可以看到原始 FID 和处理后的 FID(Processed FID 或FID')。 我们在即时处理原始数据时,不会丢弃这些数据,只是不显示它们。用户只需点击工具栏上的 "FID "图标即可查看 FID:
下拉菜单中有几个选项:
-原始FID:点击该选项将显示从波谱仪导出时的原始时域信号(FID)。 -处理后的FID:点击该选项将显示应用时域处理功能后的 FID(即紧接在 FT 之前)。 -FT1:点击该选项将显示直接维度的 FT 后数据(一维数据为频谱,二维数据为干涉图)。 -FT1': 将显示第二次 FT(以 t1 为单位)之前处理过的 fid: -FT2:点击该选项将显示二维 FT 后的数据(二维频谱)。
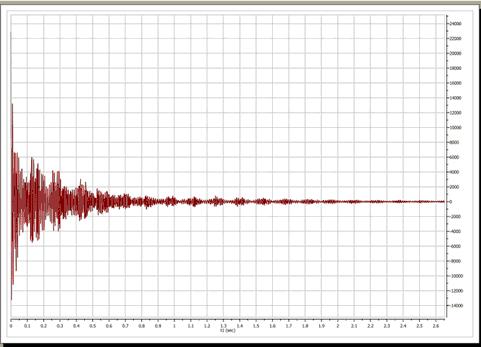
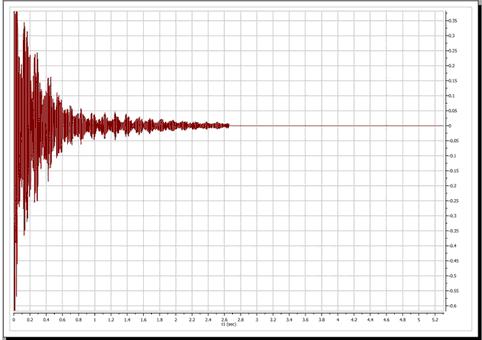
例如,这是我们测试波谱的原始 FID:
And this is the so-called FID'. In this case, prior to FT, Mnova applies a zero filling operation as can be appreciated in the FID' below. A zero fill increases the digital resolution by adding null data to the FID, increasing the size of the data array.
You can switch at any time between any of the displays (FID, FID' and processed spectrum).
Interactive Processing: Real Time Frequency Domain Processing
As we saw in the previous section, Mnova will keep all pre, during and post processing information together with the spectrum we can see on the screen. This fact, combined with the extremely fast and optimized processing algorithms implemented in Mnova, allows us to introduce to NMR processing the concept of 'Real Time Frequency Domain Processing', designed to greatly simplify processing for the user and to ensure faster and better results even when complicated operations are applied to the data.
The way this concept works is very simple: Reprocessing of the spectrum is possible at any time, independently of the time domain and frequency domain operations which may have been applied to the data set (for example, to change the window function after having applied a FT, phase and baseline correction). This is possible because, in the background, Mnova is going back to the FID and reprocessing the spectrum by applying the new functions or parameters as well as all the other functions applied ad posteriori on the previous processing. The very important advantage for the user is that he can see, in real time, the effect of any processing operation (including time domain operations) on the resulting frequency domain spectrum (for example, you can apply a more drastic exponential apodization function and see in real time, on screen, what effect this is having on the resolution and sensitivity of the frequency domain spectrum).
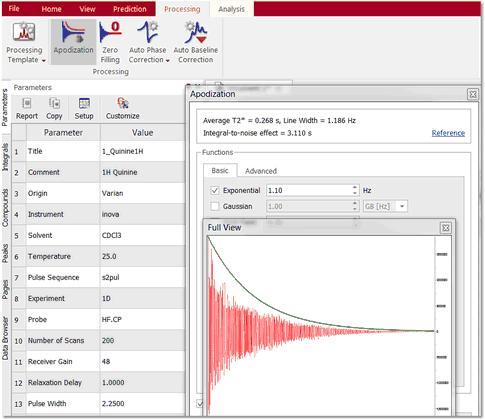
In the figure below, you can see the frequency domain 1D spectrum, the FID with the window function which is being applied interactively (which is shown graphically in the 'Full View' window (go to the 'View/Full View' menu to activate), and also the Apodization dialog box - note that the 'Interactive' box is ticked). The user can follow the exact effect of the function s/he is applying on the frequency domain spectrum. This can avoid repeated transformation and reloading of the data while the optimum processing parameters are sought and, of course, act as an excellent teaching and self-teaching tool for those who are not conversant with the effects of different processing parameters.
This same principle can be applied to all other processing operations, such as Zero Filling, Linear Prediction, Signal Suppression, etc. For example, if we want to increase the digital resolution of the spectrum, we can increase the number of points used in the FT operation by selecting Zero Filling.
Of course, standard frequency domain operations such as phase correction or baseline correction can be applied in the traditional way.
See also: |
