Properties and layouts


Properties and layouts |
|
|
Mnova allows you to customize nearly all the attributes of the spectrum. You can select the properties of the spectrum by following the menu 'Home/Properties' or by double clicking the left mouse button or pressing the right mouse button on the spectrum display and selecting 'Properties' from the pop-up menu.
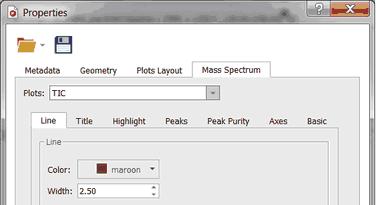
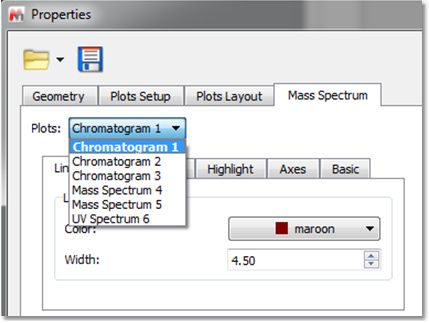
Double clicking on the spectral window will display the properties dialog box. From here you can modify the Line, Title, Peaks, Highlight, Axes and Basic properties of the TIC and MS spectrum by selecting the corresponding tab in the dialog box.
The majority of these properties are similar to NMR spectral properties. The most important difference will be in the 'Plots Layout' and 'Peaks' tab.
Plot Layouts
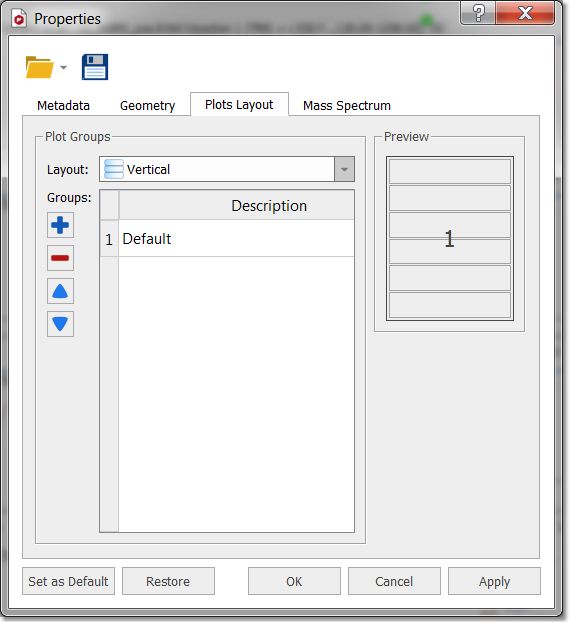
You can see below the dialog box for the 'plots layout' properties:
Clicking on the 'Add new group' button
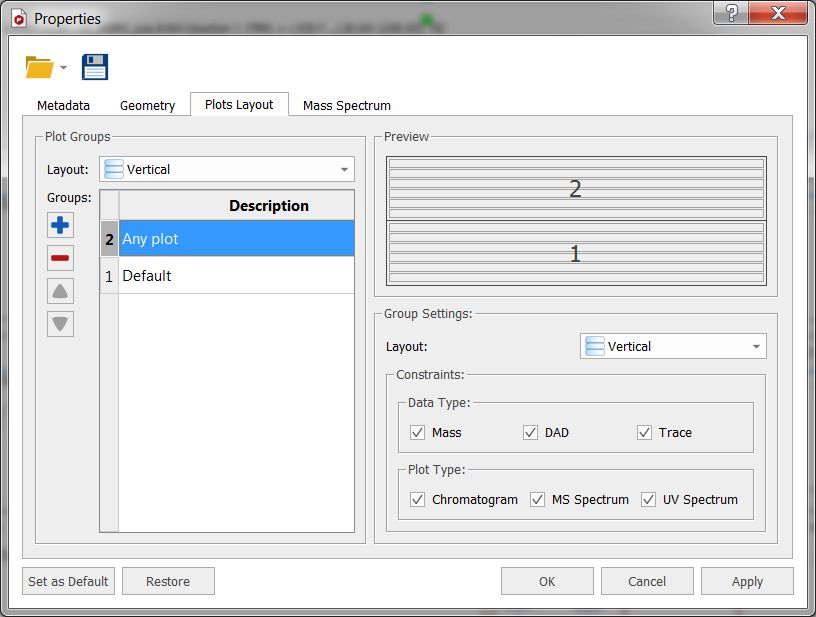
You can select the layout of the group (vertical, horizontal or grids) and several constraints about the Data Type (Mass, DAD or Traces) and Plot Type (Chromatogram, MS or UV spectrum). You can check the boxes for the applicable constraints or combine several options.
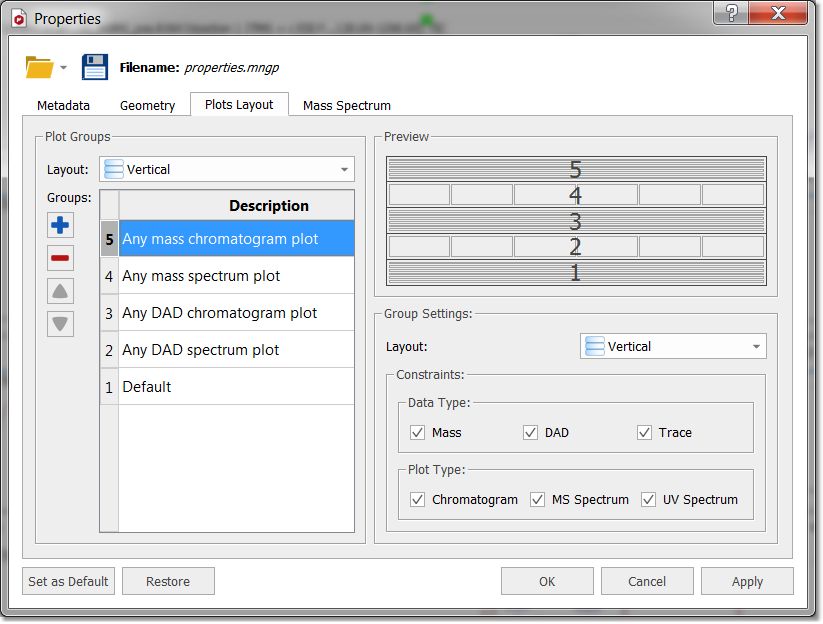
In the example below, it is shown how to create plot with 4 new groups. One group (number 5) for any Mass chromatogram plot (with any polarity or order), other group for any Mass spectrum plot with a horizontal layout (number 4), other group for any DAD chromatogram plot (number 3 with vertical layout) and another for any DAD spectrum plot (number 2; UV spectra with horizontal layout). The default group will be used in the case of any other object not present in the other groups.
You can download the 'Property' file used above from here. Next load it, by clicking on the 'Load' button of the 'Properties' dialog box and open a MS dataset. Use the MS Browser to display the DAD chromatogram and the crosshair to select the applicable MS or UV at a given retention time in the chromatogram. To get the additional spectra, you will need to click on the 'Append' button
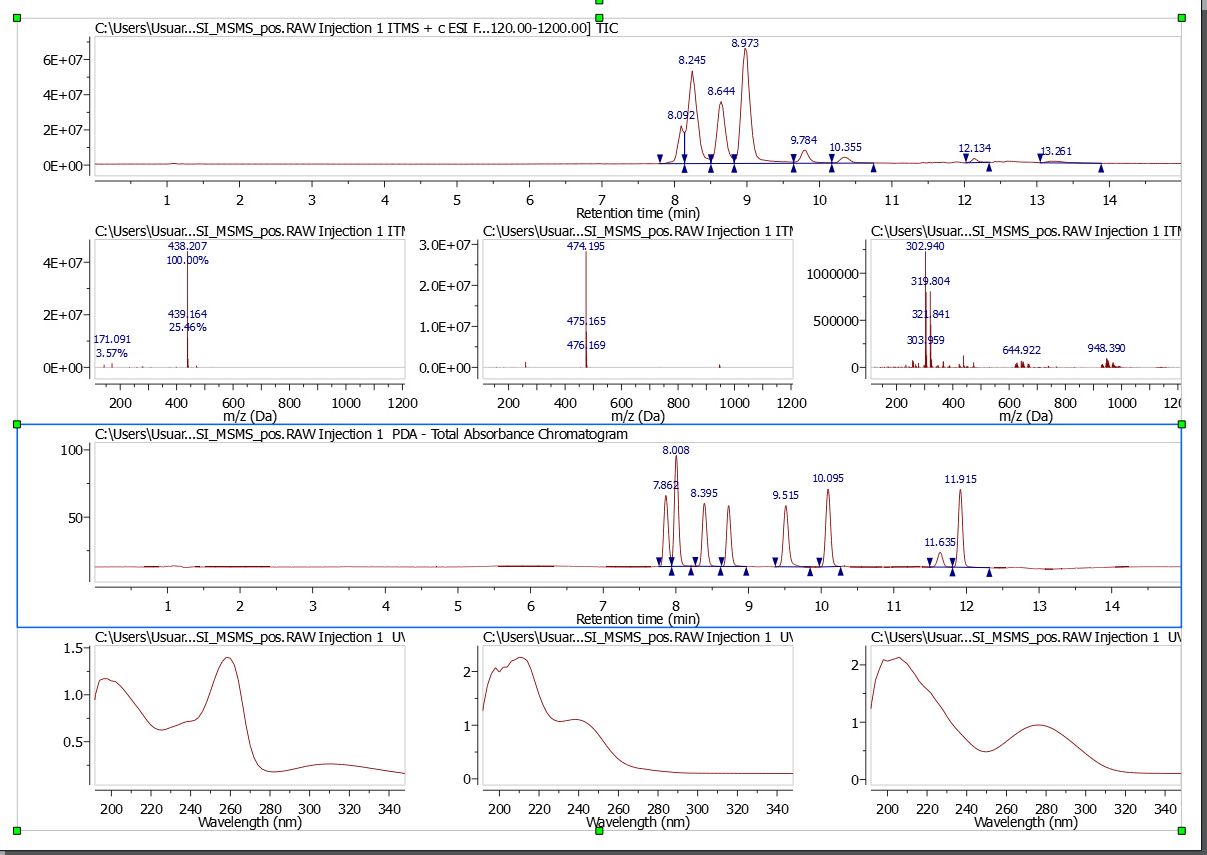
Here you can see the result with the TIC on top followed by several MS spectra, the Total Absorbance Chromatogram (as a DAD) and several UV spectra:
You can load/save and select the plot layout as default by using the applicable options in the 'Properties' dialog box.
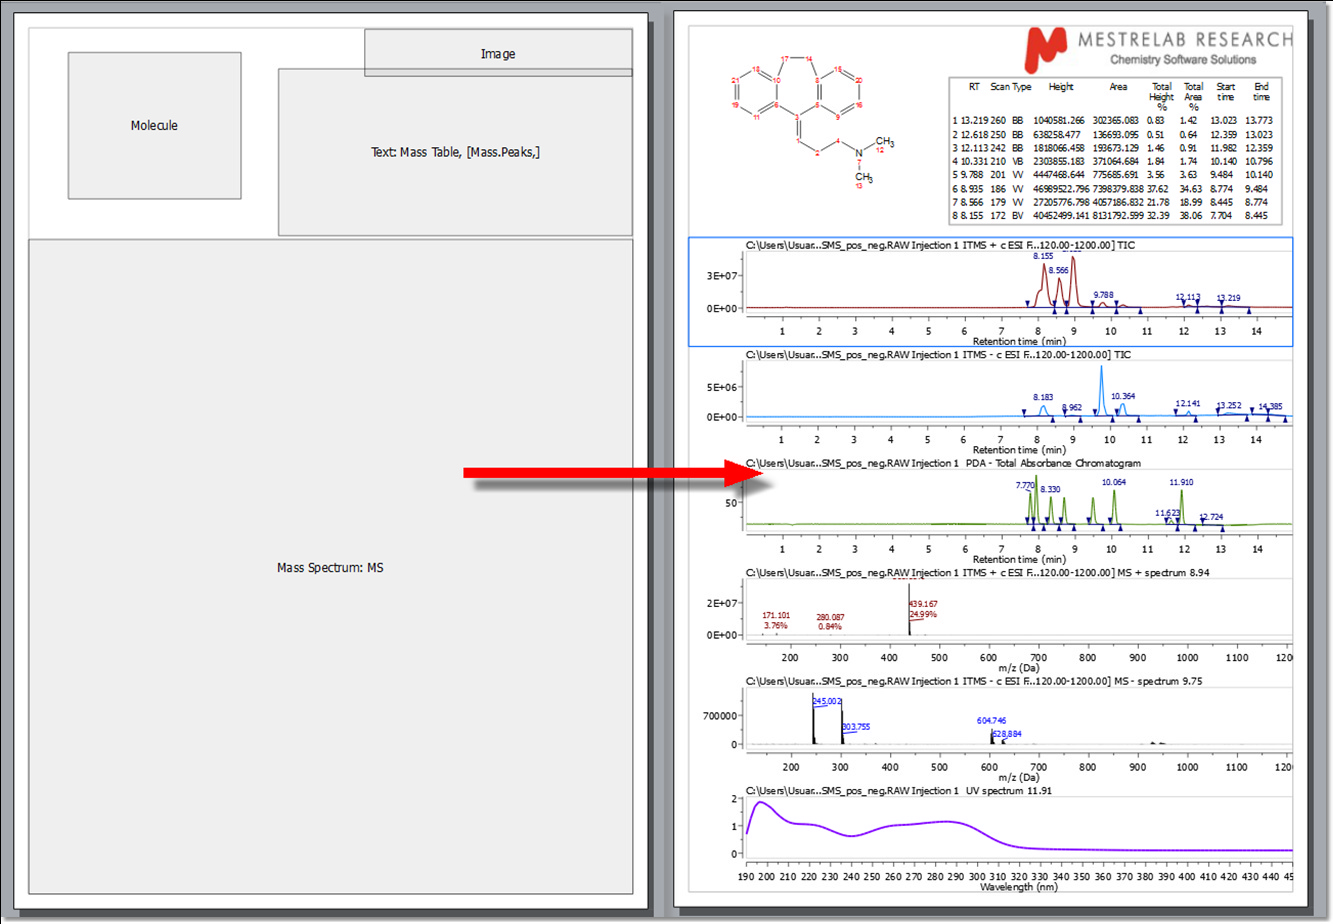
You can generate layout templates from your MS documents. Here you can see an example:
Of course, the layout templates will include the desired 'Properties' embedded, including the selected 'plots layout'. You can see the Properties embedded in a layout template, just by double clicking on each item. Double clicking on the MS box of the layout template will show you the properties of the layout for each plot (spectra and chromatograms):
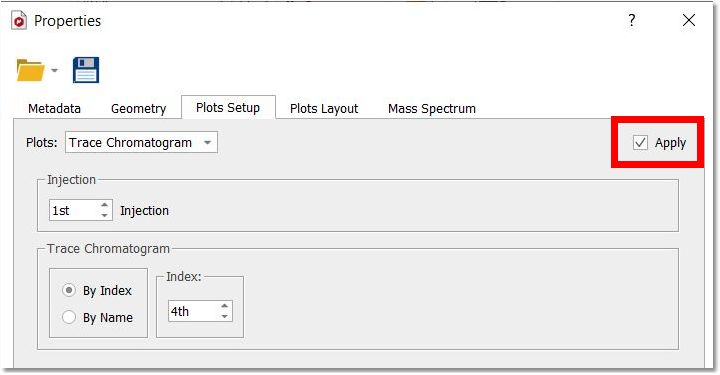
In the MS layout template documents, you can to switch ON/OFF the application of the processing specified in Plots Setup tab. The option gets correctly saved in the generated layout template documents:
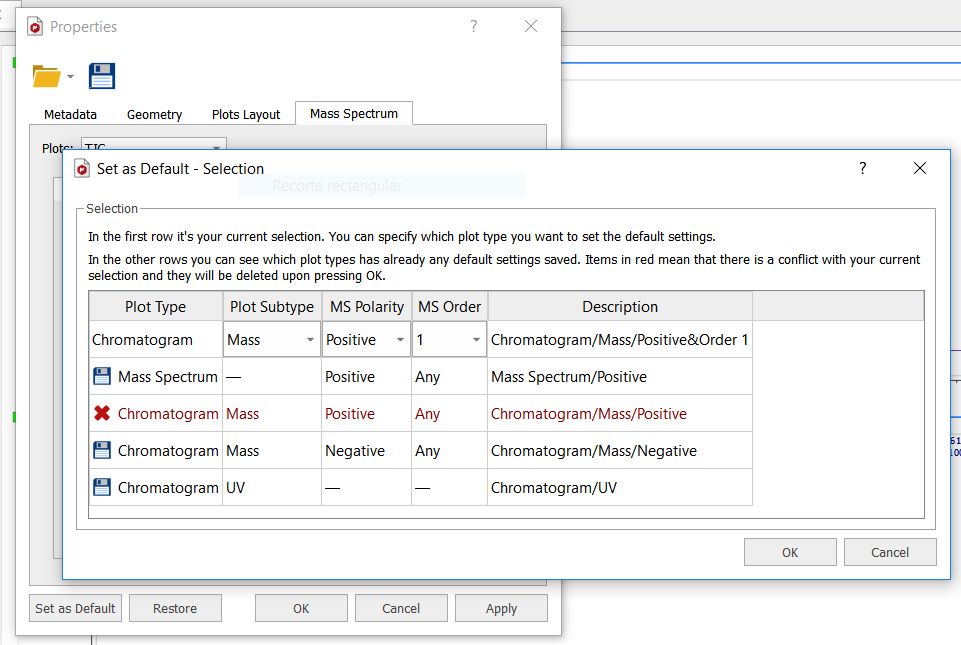
When setting as default the properties of any chromatogram/spectrum, you can choose the type of plot affected (Plot subtype, MS polarity, MS order).
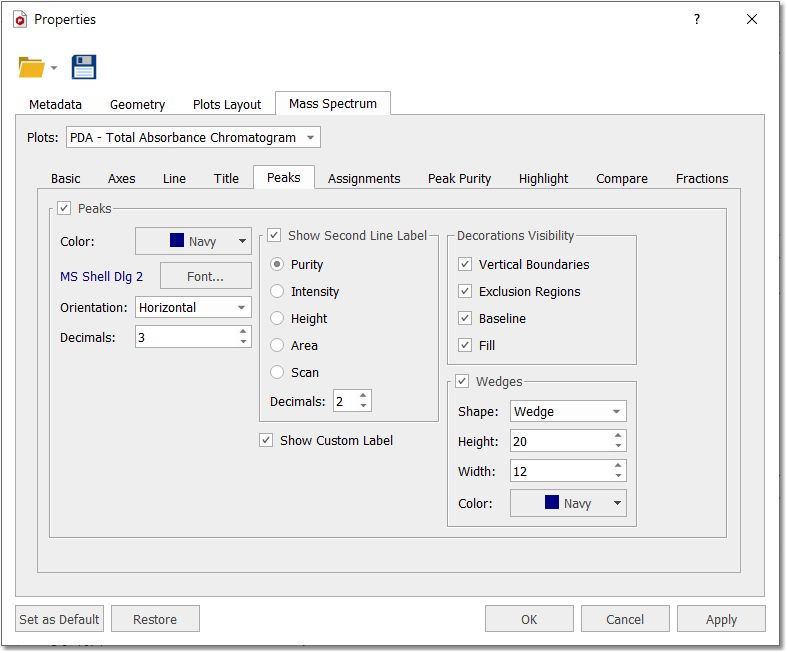
When there is a conflict: - a more general setting overwrites an existing more specific one. - a more specific setting overwrites the general settings in the specific plot. The properties of the others will be restored. Peaks Properties You can see in the picture below the 'Peaks properties' of the TIC. From here, you can 'show the wedges' and the 'baseline' (and select the threshold) or add a second line in the peak label, with information about the Intensity, the Height from the baseline, the Area, or the Purity (which will show the integral of each peak as the percentage of all integrated peaks). Please bear in mind that the Area can not be used as a quantitative value.
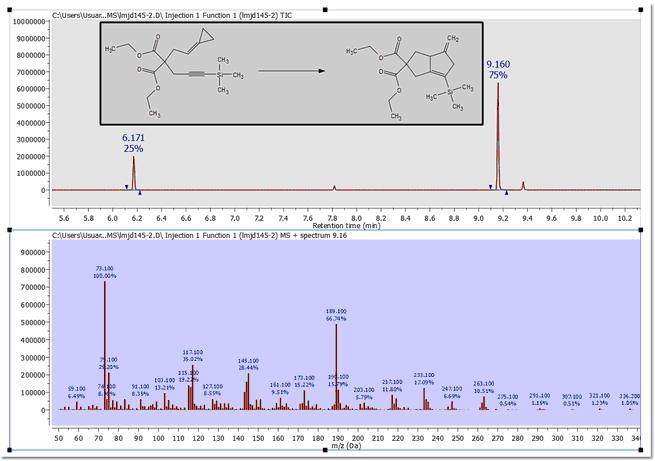
Here you can see an example of a TIC with the Purity values in the second line:
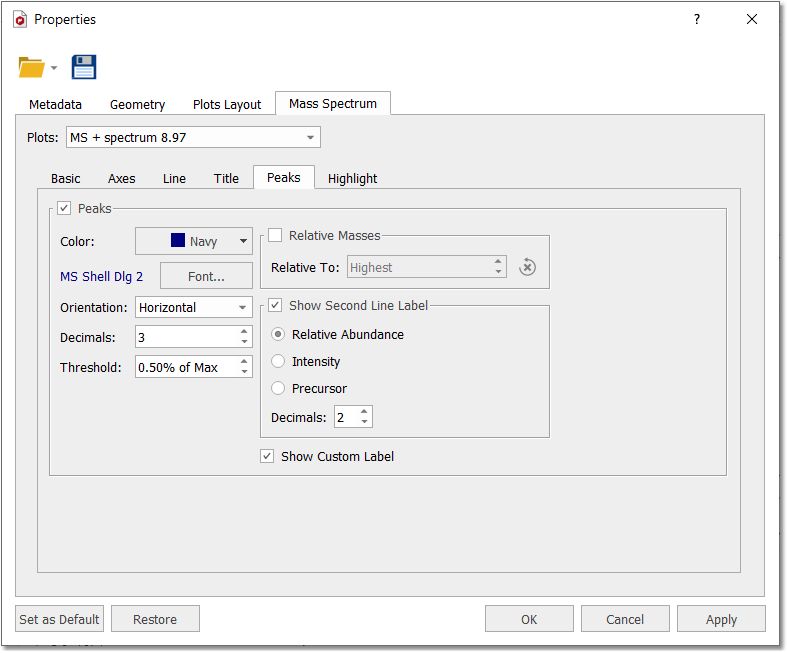
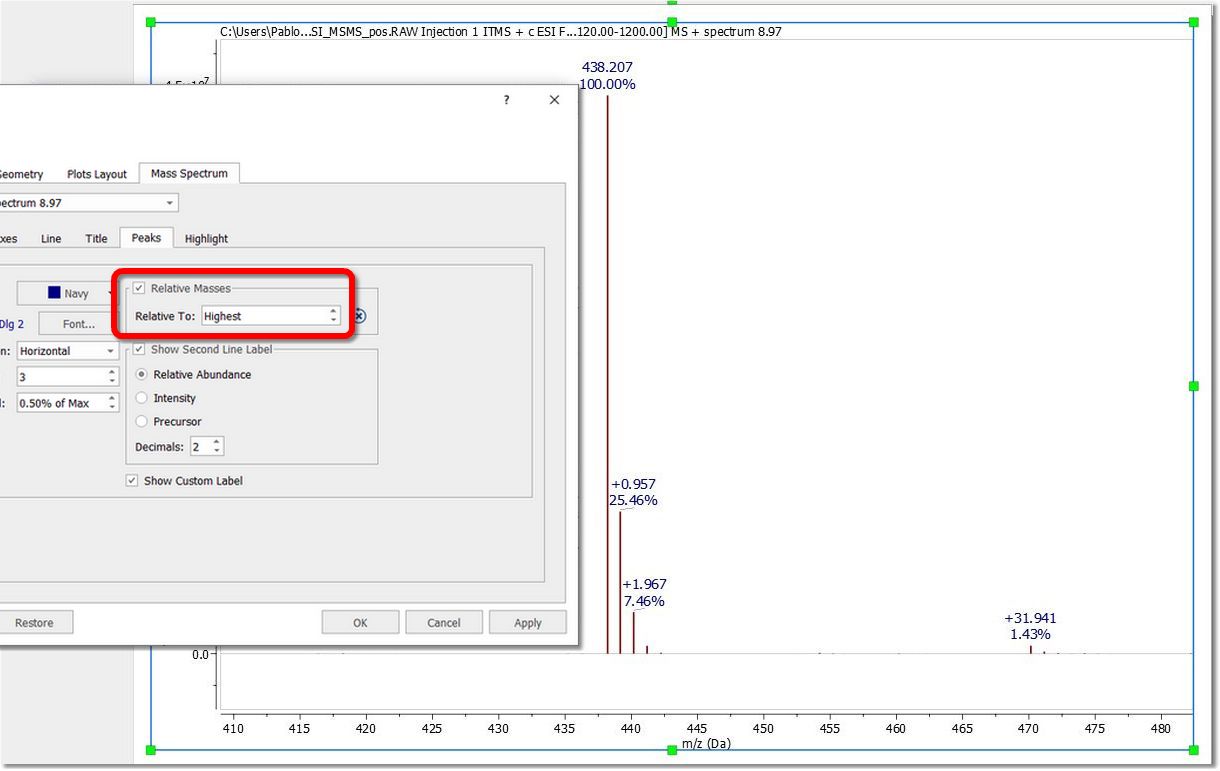
You can see below the 'Peaks Properties' dialog box of the MS spectrum. In this window, you can change the Color, Font and Number of Decimals of the Peak label and you can also show/hide the 'Second Line Label (which can contain information about the 'Intensity' or the 'Relative Abundance').
You can enable the display of relative masses instead of absolute ones by checking the applicable box. The masses will be relative to the position of the highest peak in the current view. So if the user wants to see the relative masses for one specific peak he must ensure that that peak is the highest one in the current view. Such property will be disabled by default.
From 'Properties/Peaks' dialog, it will also be possible to change the orientation of the peak labels (horizontal/vertical).
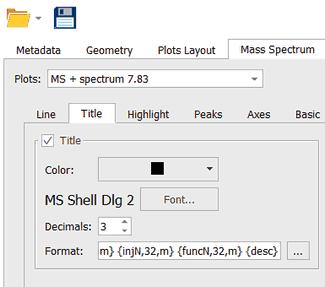
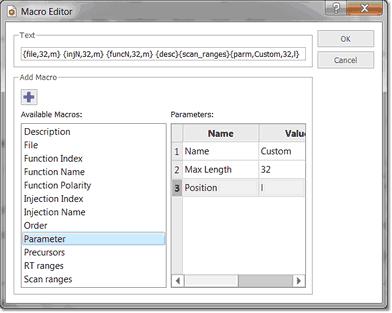
Selecting Title in the tabbed menu, will display the below window:
Clicking on this icon
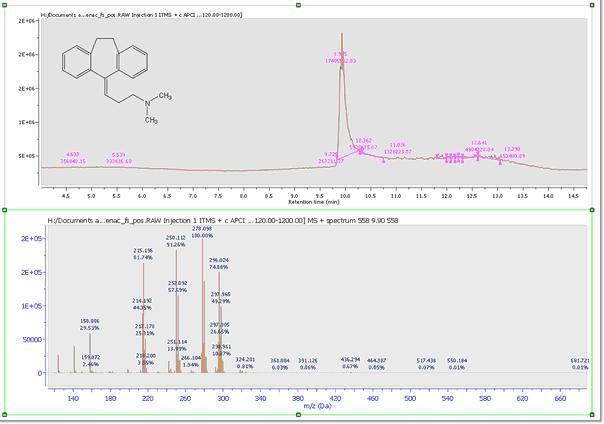
Here you can see an example of a TIC and MS after having changed some properties:
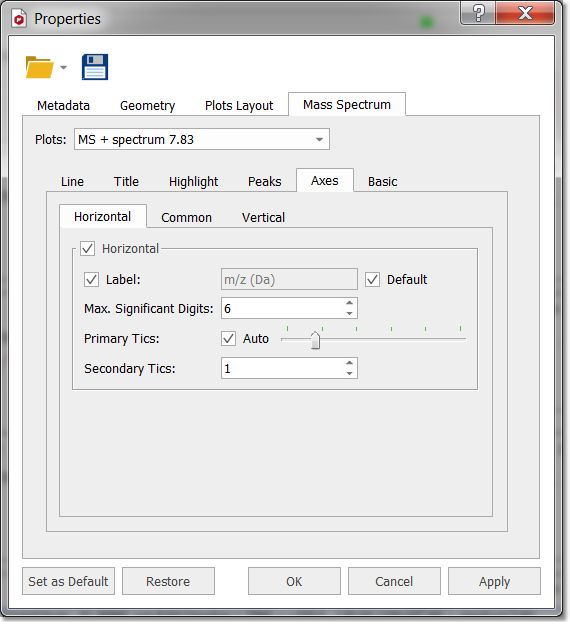
Selecting the Axes tab will allow you to change the Units individually for each plot:
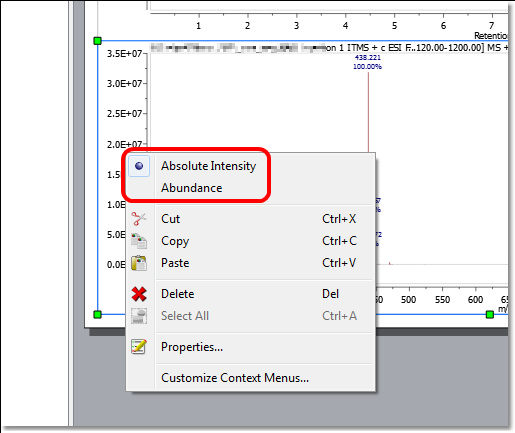
If you want to change the units for all the Mass spectra, youy would need to use the context menu (by right clicking on the vertical axis):
Label: When the default box is checked, it means that the label will be set by Mnova to the default value for that kind of plot (so the label line editor remains disabled). If it's unchecked, then the label will be set to whatever the user sets in the line editor.
The default values are: Horizontal axis: Mass spectrum: m/z (Da) UV spectrum: Wavelength (nm) Chromatogram: Retention time (min)
Vertical axis: Mass spectrum: Intensity UV spectrum: Absorbance Chromatogram: If the current data provider, provides an axis label, that will be used. If not, either Absorbance or Intensity regarding if it is a UV chromatogram or any other kind of chromatogram respectively.
You can read more about general Mnova properties here. |