Properties


Properties |
|
|
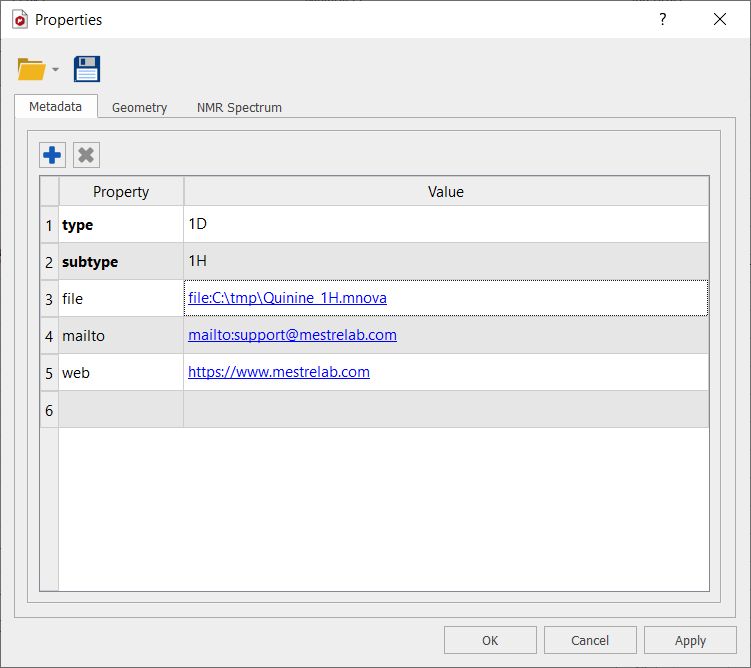
Properties: Mnova will allow the user to customize nearly all the attributes of the spectrum. The user can select the properties of the spectrum by following the menu 'Home/Properties' or by pressing the right mouse button on the spectrum and selecting 'Properties' from the pop-up menu.
From the metadata tab, you can add hyperlinks to include websites, files or email address:
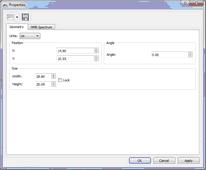
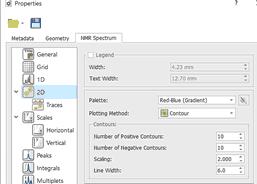
You can see in the pictures below the geometry and the Spectrum properties of a 2D NMR experiment.
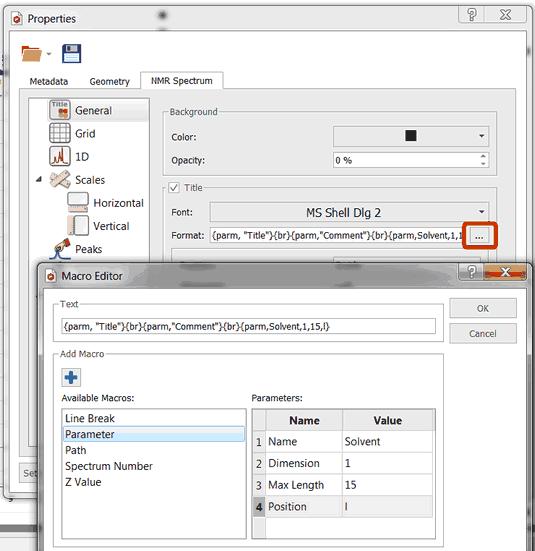
From this set of tabbed pages you can change, for instance, the spectrum's geometry (position, angle, size), the traces size, the 'Background', the 'Line-Style' (line, crosses or circles), the 'Line Colour' and the 'Line Width'. Bear in mind that a 'Line Width' of zero indicates a cosmetic pen. This means that the pen width is always drawn one pixel wide, independent of the transformation set on the painter. In 2D NMR spectra, you can set the legend, the number of contours, ploting method, show traces and customize the palette. The user can also set the scales' properties, change the grids, the aspect of the axes and margins or the units (ppm, Hz, points, seconds), for a more convenient representation of the spectrum. You can change the color of the spectrum background to suit your eyesight, your working hours, or your mood. Enjoy complete freedom on how to present your data! Transparency is also supported! Here you can see an example: Check the 'Title' box of the 'Spectrum/Common' properties to show the title on your spectrum. You can select the position/alignment/offset of the title and also to customize the format by clicking on this icon
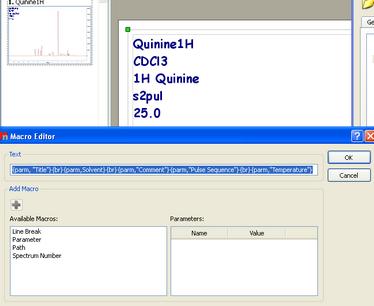
Here you can see an example where we have changed the font of the title and added several parameters (Title, Solvent, Comment, Pulse Sequence and Temperature) to the title of the spectrum:
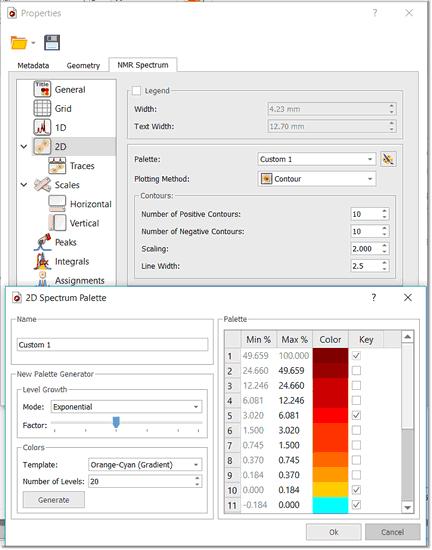
The user will be able to select the desired 2D spectrum palette and also customize his own palette by selecting for example 'Custom 1' in the 'Palette scroll down menu and then clicking on the 'Palette Editor' button
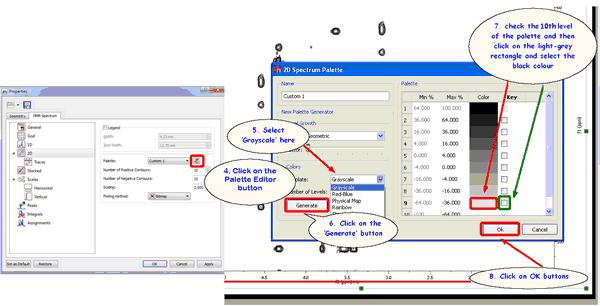
If you want to obtain monochrome printouts different with the ones that already exist in the Palette scroll down menu, please follow the procedure below to create a palette in pure black with no grayscale:
1. Run Mnova and load your 2D-NMR spectrum. 2. Double click on the spectral window to open the ‘Properties dialog box’ 3. Select ‘Custom 1’ on the ‘Palette’ scroll down menu 4. Click on the ‘Palette Editor’ button (just at the right side of the scroll down menu) 5. Select ‘Grayscale’ on the ‘Template’ colours scroll down menu 6. Click on the ‘Generate’ button 7a. If you have 10 levels, check the 10th level of the palette and then click on the light-grey rectangle (just at the left side of the check mark) and select the black colour. Finally click on ‘OK’ buttons.
7b. If you have 20 levels, do the same with the 20th level and so on… For further information, please take a look a this video
Let´s take a look at another situation: how to make all positive contours a scale of greens and all negative contours a scale of blues?
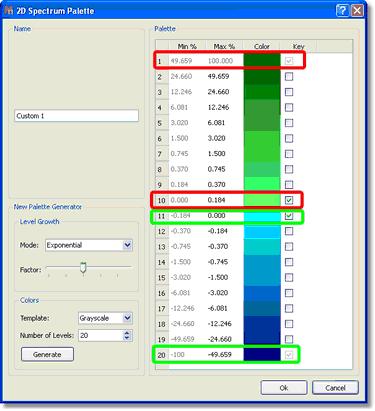
In this case, you will only need to select in the '2D Spectrum Palette' dialog box the first and the last colour of the positive peaks and the same for the negatives. For example, imagine that you have 10 positive contours, then you will need to select the colour of the contour 1 as 'dark green' (for example) and then check the applicable mark at the right side. Finally, select the colour of the contour number 10 as 'light green' and check the mark. Do the same for the negative peaks; in this case the contour number 11 will be 'light blue' and the number 20 will be 'dark blue'. Please take a look at the screenshot below for further information.
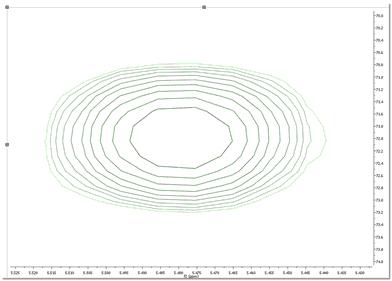
You can see below an expanded signal after having applied the resulting palette (obtained in the previous step):
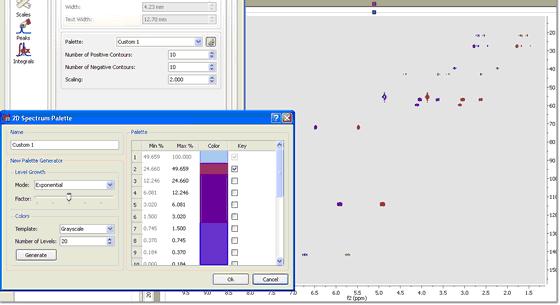
You can change the colours of the 2D overlaid spectra by following the above procedure (but changing the colours). You will find below two overlaid spectra with different colours (one red and the other purple). Please bear in mind that you can move from one spectrum to another (in the overlaid) by holding down the 'Shift' key and using the arrow keys (or the mouse wheel):
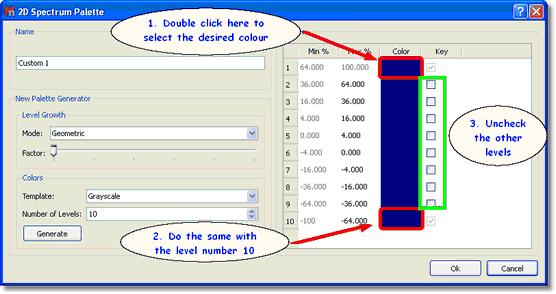
Of course, you can also make your 2D spectrum with a single color (no ramp). Once you are in the 'Palette Editor' dialog box, double click on the coloured rectangle of the level number 1 and select the desired colour, do the same with the level number 10 (bear in mind that you select the same colour) and uncheck any other key mark that could be in the other levels:
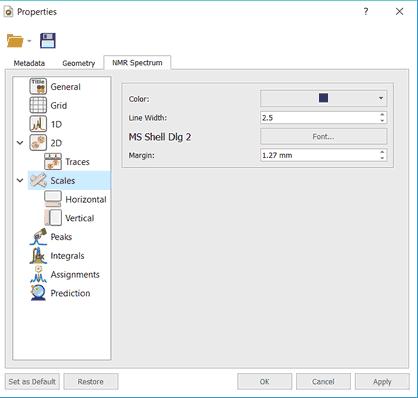
You can change the 'Scale Properties':
From here the user can change the properties of the horizontal and vertical scales:
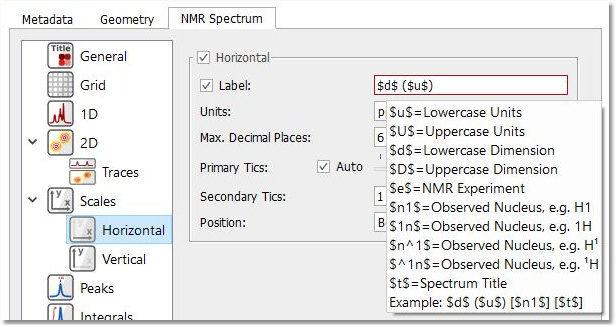
The user can include the spectrum title (the title set previously on the spectrometer at acquire time) on any axis label by typing '$t$' in its applicable edit box. Bear in mind that, Mnova will only show the first line of the original title. This title appears by default on each page of the page navigator.
Hovering the cursor over the label edit box will reveal other commands for including information on the axis label, such as: $u$ = Lowercase Units; $U$ = Uppercase Units; $d$ = Lowercase Dimension; $D$: Uppercase Dimension; $e$ = NMR Experiment, or $1n$ = Observed Nucleus (e.g. 1H, 13C...).
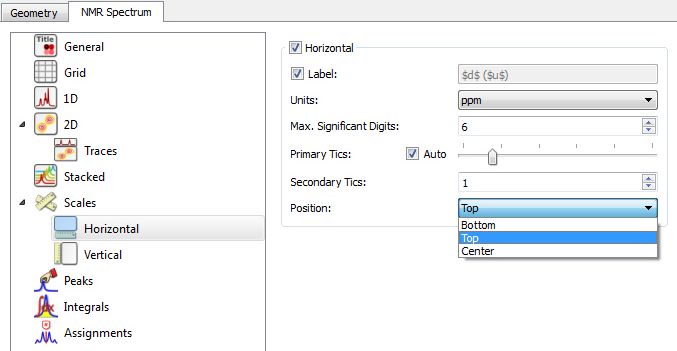
You can select the Maximum significant digits and the number of Primary and Secondary tics of the scales and to select the position of the scales.
The user will be able to save his/her own properties just by clicking on the Save Properties' icon. The Saved Properties will be opened by clicking on the 'Load Properties' icon. You can set the current properties as default by clicking on the 'Set as Default' button. Clicking on the 'Restore' button, will restore the predefined properties.
The user can also modify many other features such as the parameters and properties of the peaks or integrals. We will not go into further detail here since all the property pages should be self-explanatory and a description of each one can be found in its applicable section of this manual.
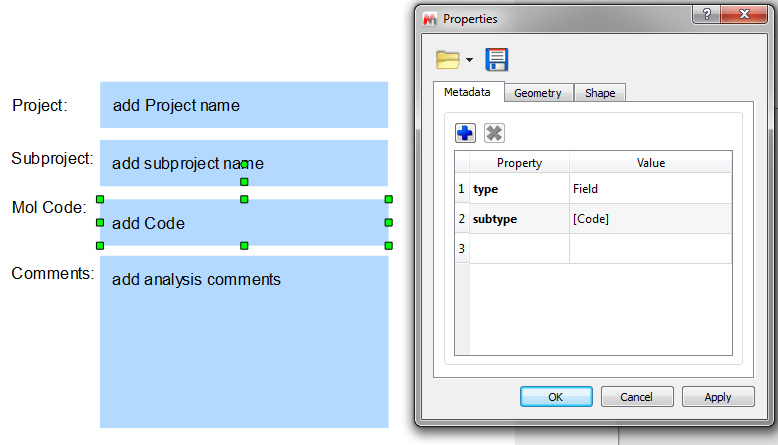
The text boxes will also have its own 'Properties', even we can add text properties to the page items and edit them by selecting the 'Metadata' tab:
|