MS Browser


MS Browser |
|
|
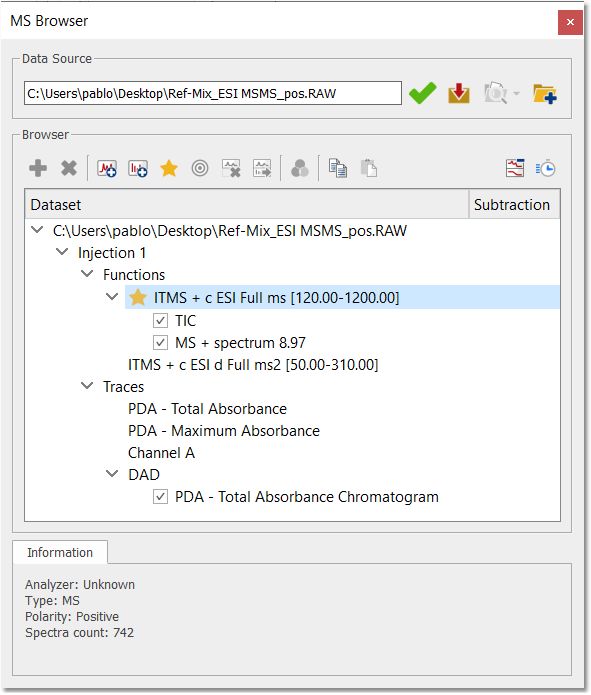
This panel will be displayed by default when you load a dataset. If it is hidden, you can show it by clicking on the corresponding icon
This dialog box will contain information about the 'Data Source'. If the current spectrum contains the original spectrum file, the 'Data Source' will show a green tick mark. If not, it will show a red cross (and the spectrum will have a red frame); which indicates that you will not be able to load any other part of the chromatogram and you will only be allowed to work with the spectrum that you have on the screen.
You can hide any chromatogram or MS spectrum by checking the corresponding check box in the 'MS Browser' or by selecting 'Hide Plot' in the context menu of the spectrum (which can be accessed by right clicking on the spectral window).
If you want to delete the plot from the Browser, just select it and click on the red cross button. The same result will be obtained by selecting 'Delete Plot' in the context menu. You can also hide and extract to any page the selected plot:
You can also use the Plots Visibility ribbon to hide/delete/extract plots:
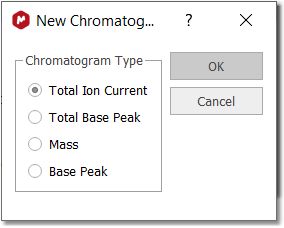
Double clicking on any function from the MS browser, will display the applicable dialog box, which will allow you to open the TIC, Base Peak or the Mass spectrum. The same result will be obtained by highlighting the applicable function and clicking on the 'New Chromatogram' icon:
•TIC (Total Ion Current): The sum of all the separate ion currents carried by the different ions contributing to a complete mass spectrum or in a specified m/z range of a mass spectrum (this is sometimes called the reconstructed ion current).
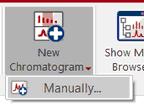
You will obtain the same result by selecting 'Manually' on the scroll down menu of the 'New Chromatogram' button of the toolbar:
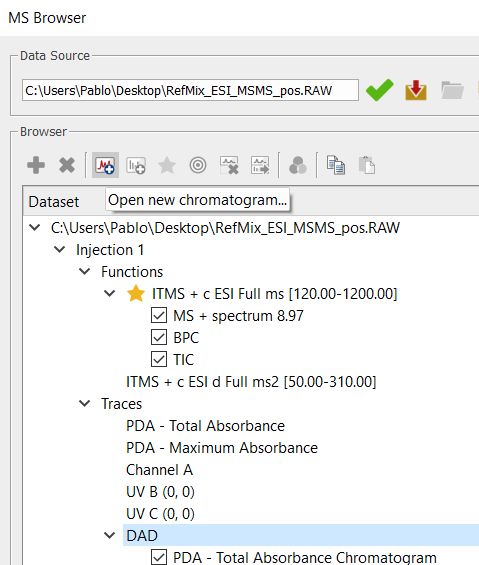
You can display any trace (i.e PDA or UV chromatograms) by double clicking on it or by selecting it on the MS Browser and then clicking on the 'Open new Chromatogram' icon.
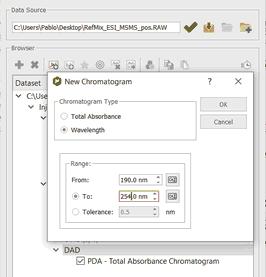
If your dataset contains UV traces (DAD) and it is in Masshunter, Bruker Compass, Shimadzu v5, Xcalibur or MassLynx format; you can extract them or select a range in the wavelength; by selecting the applicable option after having clicked on the 'Open new Chromatogram' icon
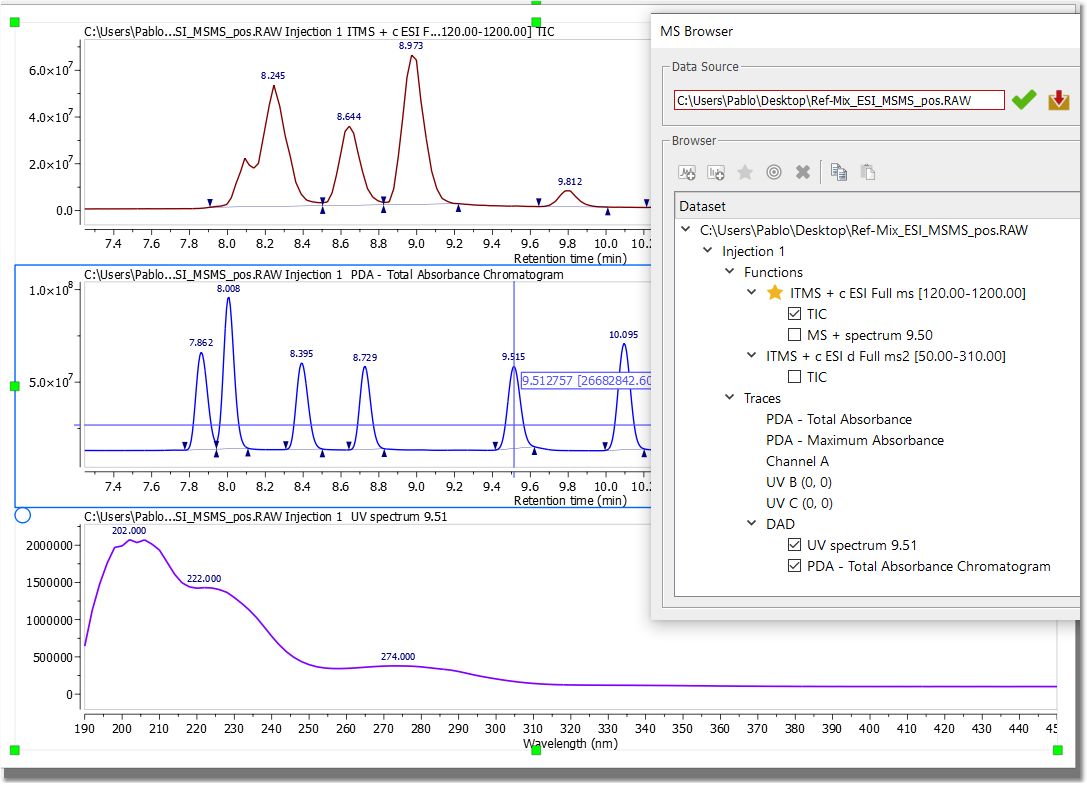
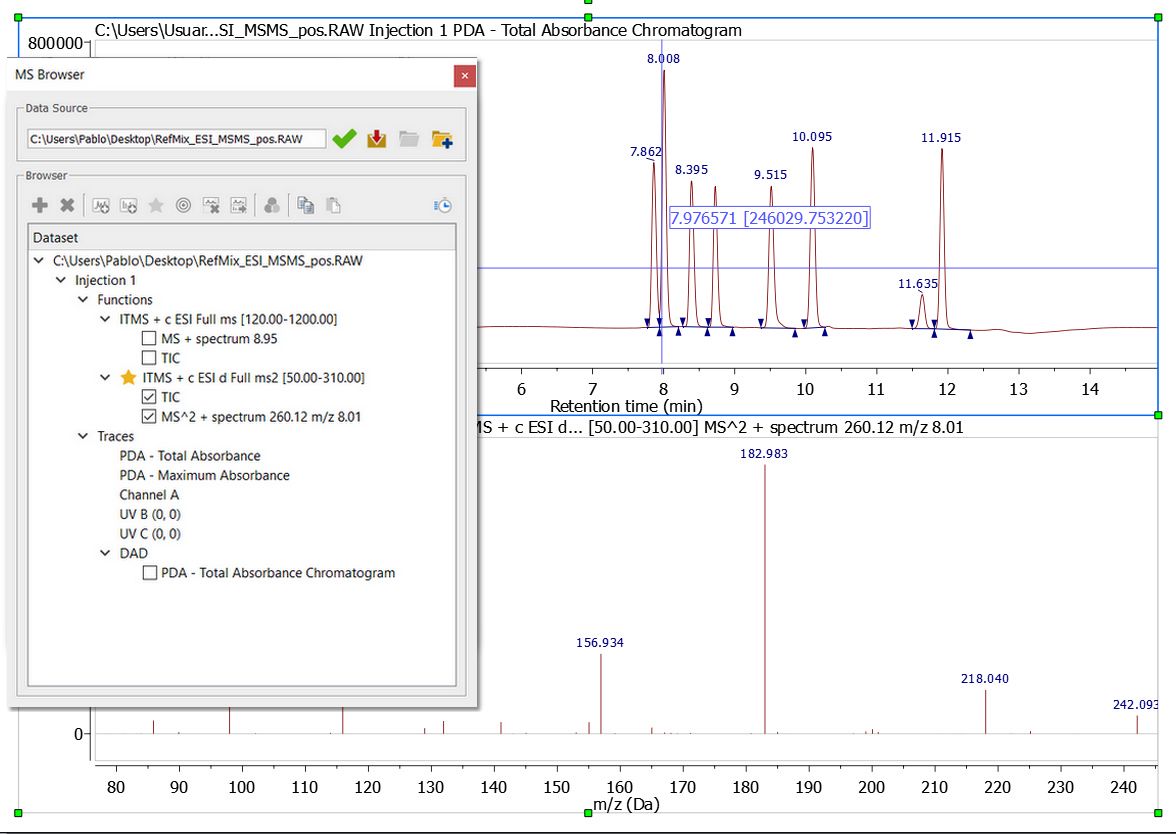
From the PDA-Total Absorbance Chromatogram, you will be able to extract the complete UV spectrum. To select a UV spectra: the dataset must have the full UV spectra set (and not just a single or a set of UV chromatograms, ie, MS browser panel must show a sub-item called DAD under the Traces item). Using the crosshair mode and clicking on a UV chromatogram while holding Alt pressed, will display the UV spectrum for the clicked retention time.
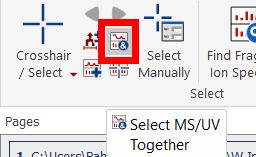
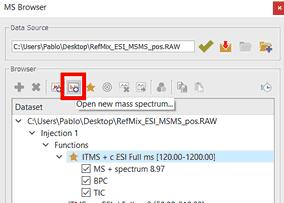
You can display the UV together with the MS by selecting the applicable feature from the ribbon: You can also Co-add UV chromatograms by clicking and dragging the crosshair to select a range on DAD chromatograms as you can do with the TICs. Please bear in mind that Mnova MSChrom only supports UV spectra from Masshunter, Bruker Compass, Shimadzu v5, Xcalibur or MassLynx formats. The new button opens a new dialog that list all functions displayed in MS Browser that are compatible with the selected function: same spectrum number, same polarity,... In short, the same Information that is displayed at the bottom of the MS Browser (Note that "Information" is now a tab, not a group). This button is only enable when a MS function is selected and there is more than one function loaded in the MS Browser. Note that the background function must be in the same MS item as the foreground function. Highlighting any function in the MS Browser and clicking on the 'New Spectrum' icon will display the corresponding dialog box which will allow you to open the desired spectrum by just typing the number on the edit box:
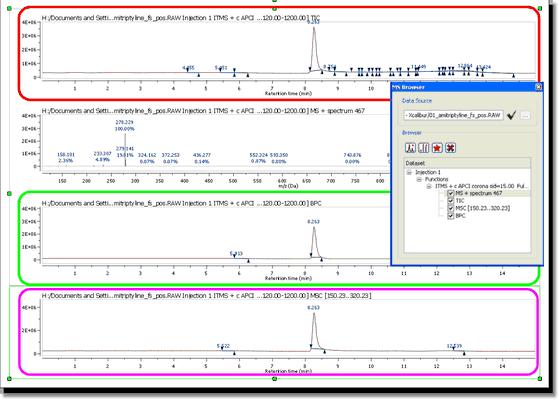
The below picture will show you a TIC (red), a Mass spectrum (number 467), the Base Peak (green) and the chromatogram between m/z=150.23-320.23 (pink):
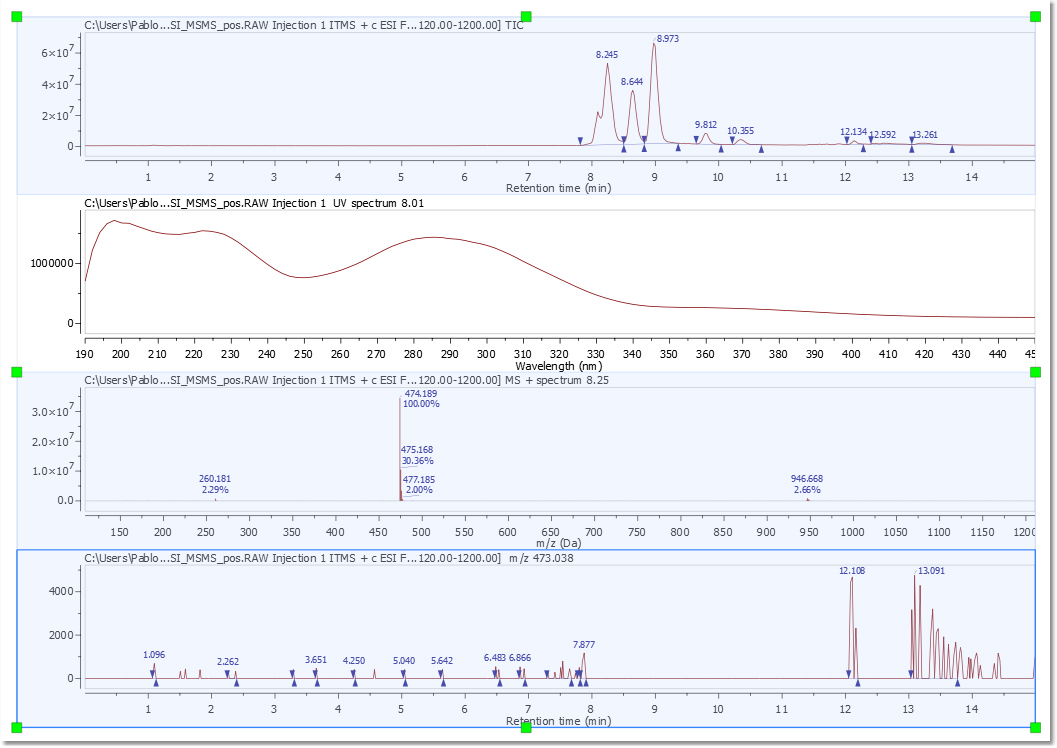
In the example below, you can see two TICs of two different functions:
Selecting a function on the MS Browser window and clicking on this button
If you have two or more spectra opened in the document, you can use the feature to 'Select the spectrum plot as selection target'
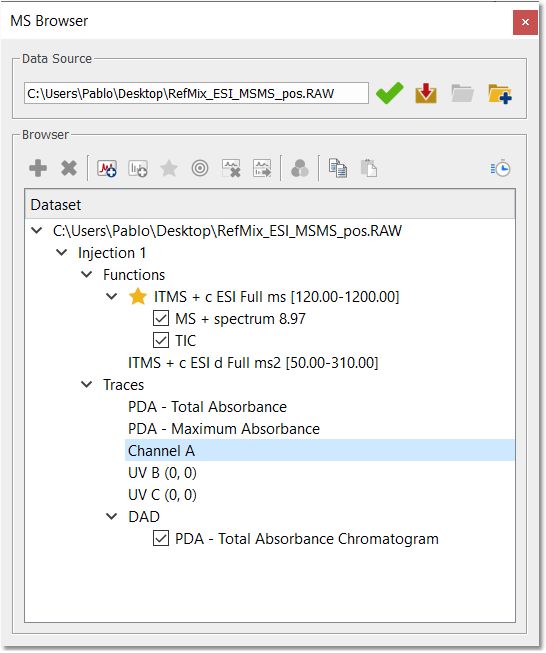
Please bear in mind that different mass spectrometer acquisition data systems do different things with the names of traces. When we import traces, we do our best to retrieve sensible names, but they are not always present (or appear as 'Channel A' for example). We hope that the chemist who acquired the data will usually know what "Channel A" actually is.
You can select several chromatograms or spectra in the same page, for example to 'zoom in' or extract them to a new page at the same time. To do it, just hold down the 'Ctrl+Alt' ('Cmd+Alt' in Mac) key and click. Ctrl+SHIFT+Alt will select all chromatograms. To release the selection, press 'Ctrl+Alt' (Cmd+Alt in Mac) and click on the undesired item.
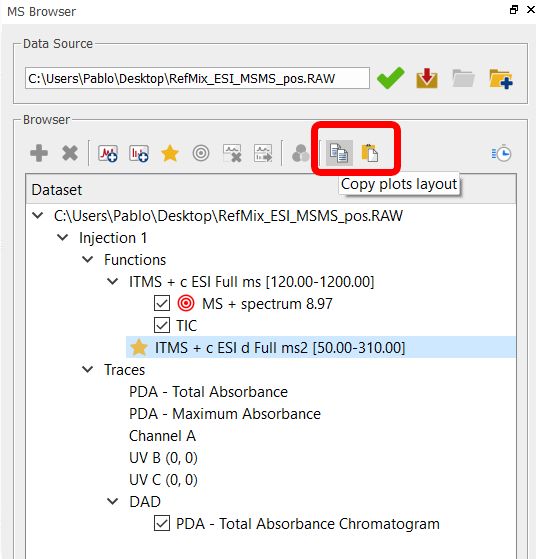
From the MS browser panel, you can copy the display configuration and paste it to a second dataset:
Use the this button
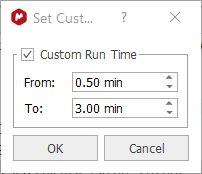
In addition,from the 'Preferences', you can define rules to apply custom run time ranges automatically when importing a mass dataset:
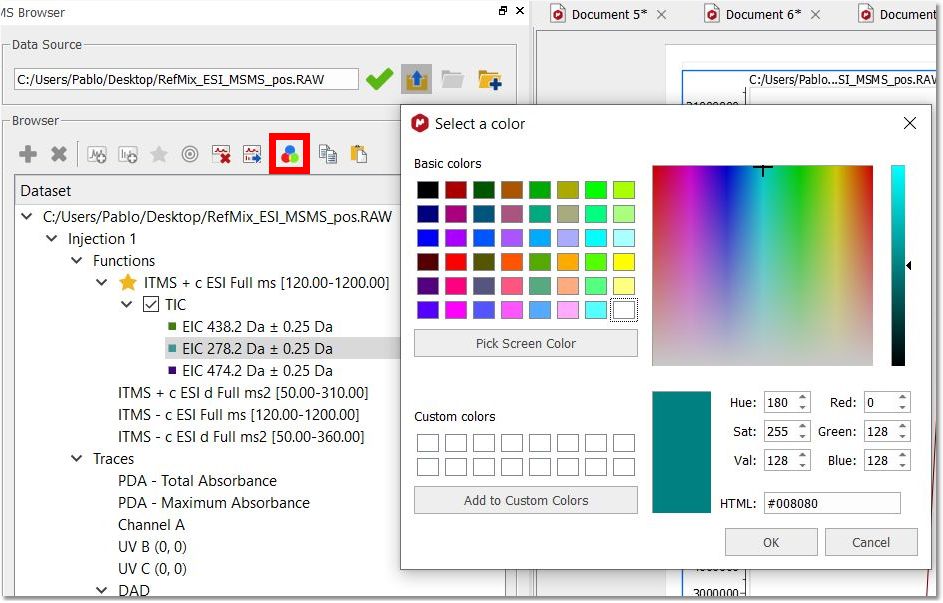
If you are working with superimposed chromatograms, you can change the colors from the MS Browser:
You can open several dataset files into the same mnova document. There are two ways to do it from the Mass Browser:
1.Click on the icon with a plus sign over a folder, at the right of the current dataset location, to choose another dataset to be added to the item 2.Click on the plus icon to chose a dataset from another mass item already in the document. There is also a minus icon to remove a dataset and all the plots belonging to it.
|