NMR Tools


NMR Tools |
|
|
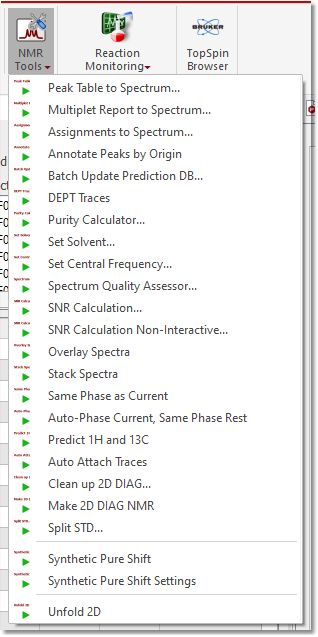
You will find several scripts under the 'Tools/NMR Tools' menu:
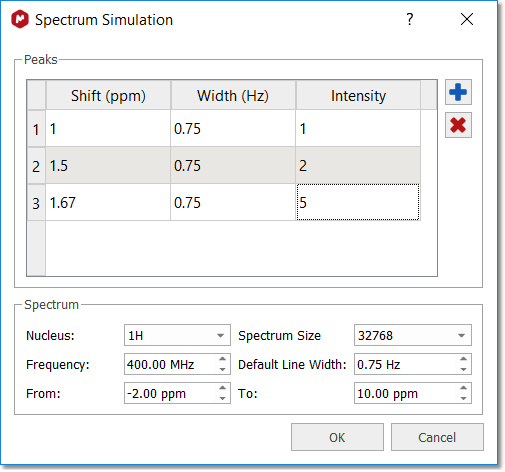
Peak Table to Spectrum This script will allow you to synthesize a NMR spectrum from a peak table:
Multiplet Report to Spectrum To synthesize a spectrum from a multiplet report copied from a paper. See this chapter for further information.
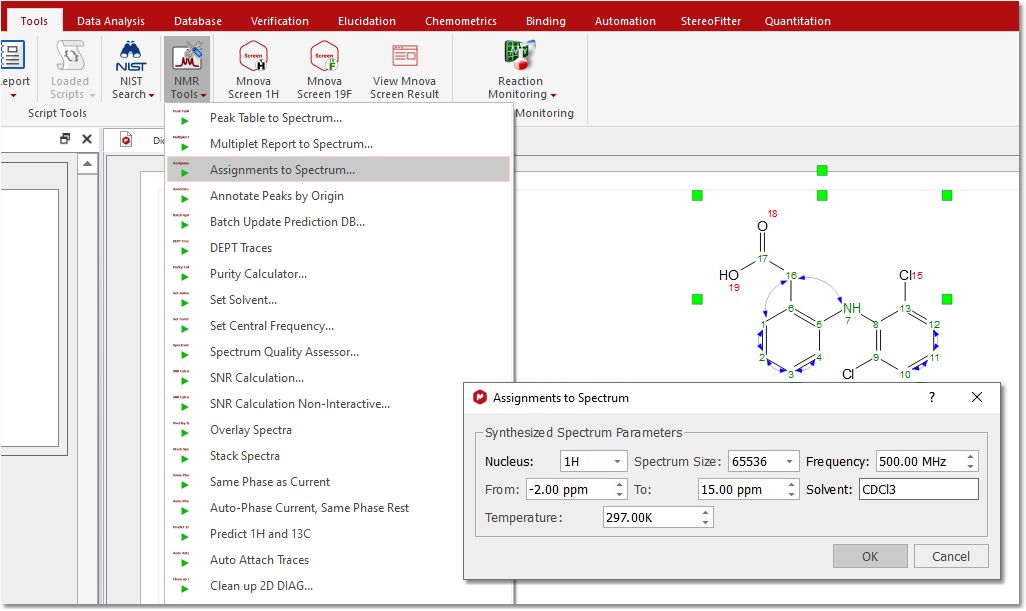
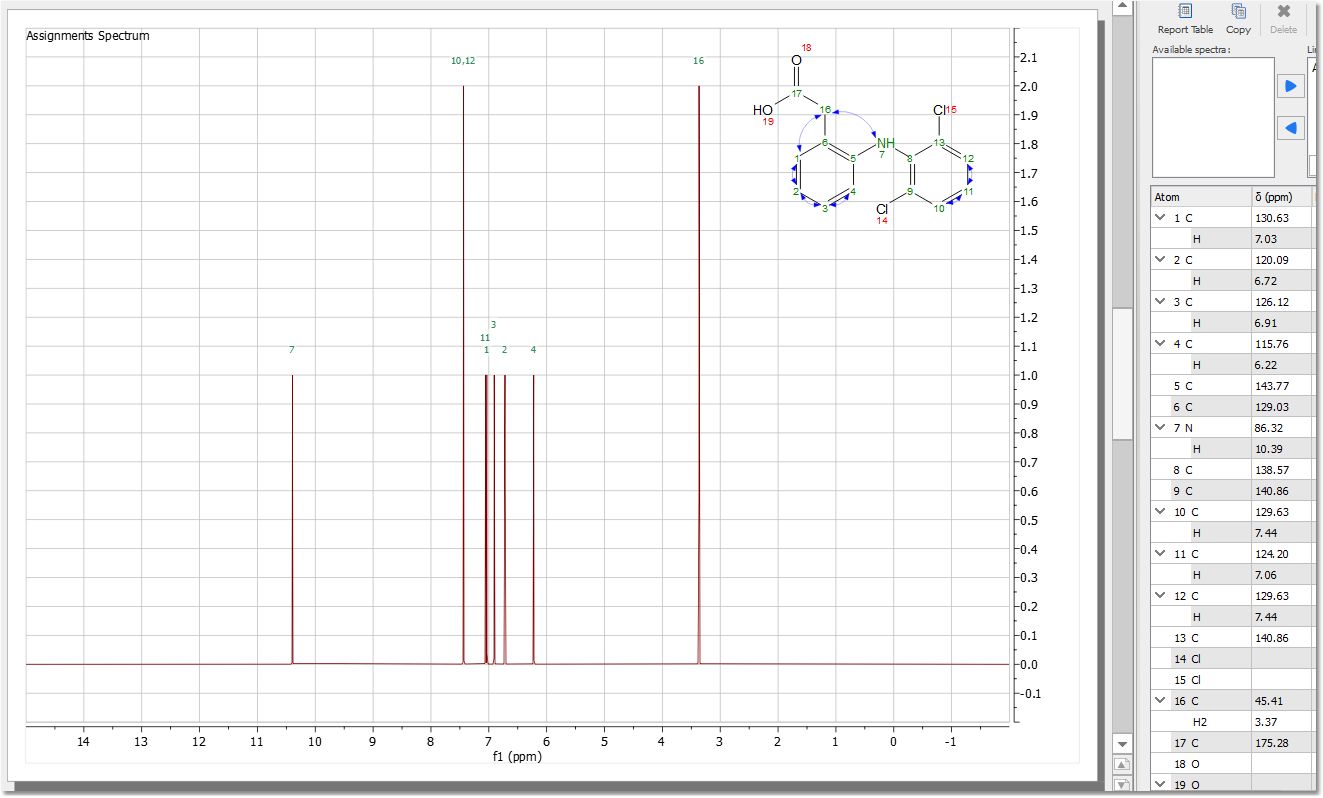
Assignments to Spectrum To synthesize a spectrum from the molecular assignments:
Once you have selected the desired parameters, you will get your synthetic spectrum:
Annotate Peaks by Origin This script can be used to know the peak picking method which was used in any processed NMR spectra:
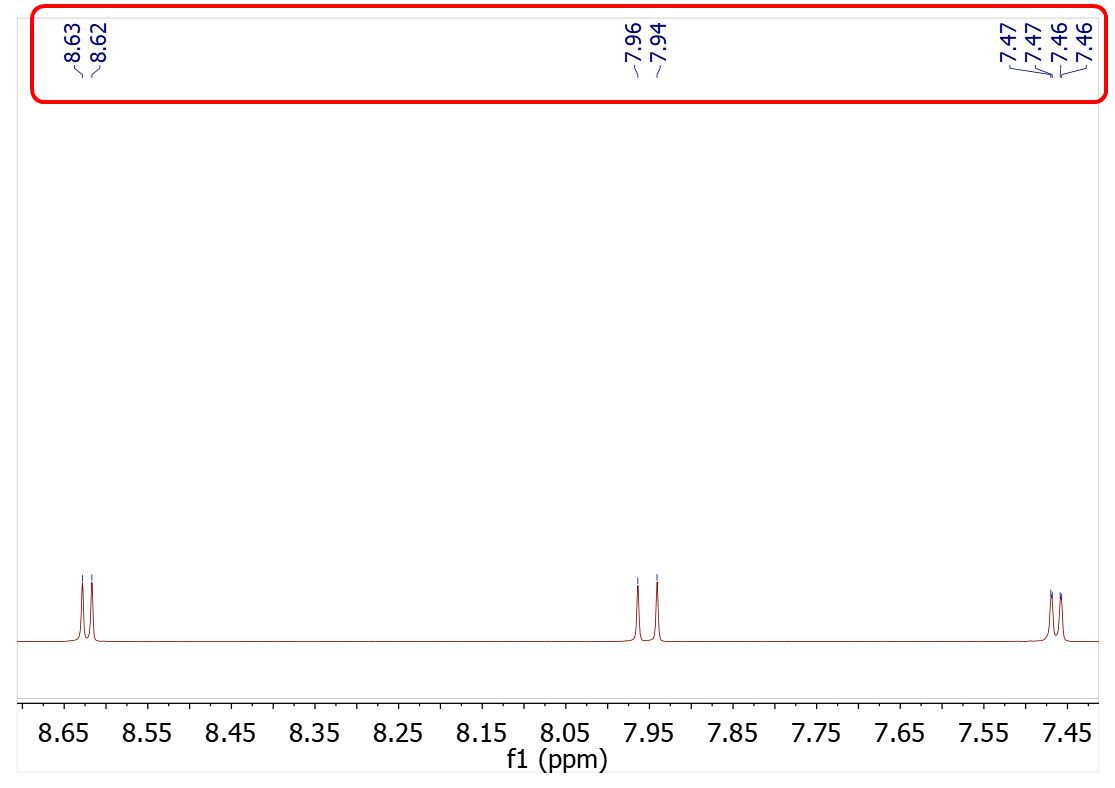
Now let´s see how it works. First of all load an spectrum file and apply a peak picking method. Mnova will show you a pick list with labels on the top of the spectra (red square in the image below):
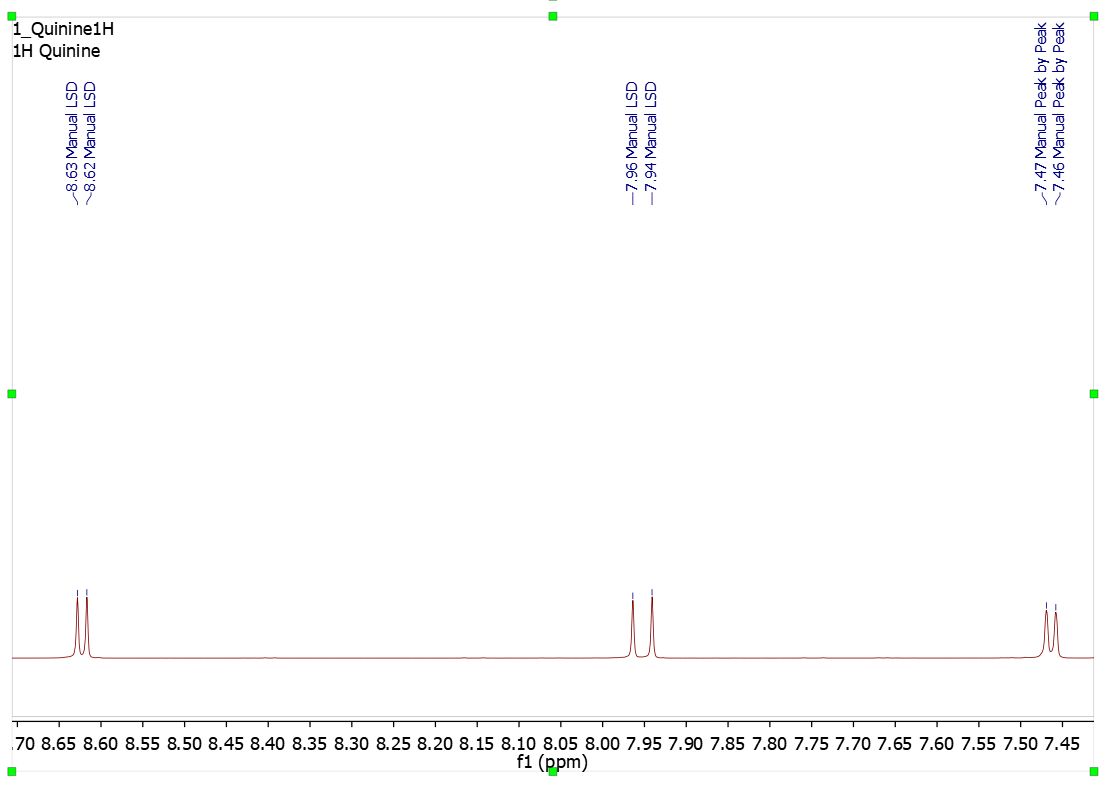
Then, apply the 'Annotate Peaks by Origin' script by following the 'Tools/NMR Tools' menu. After that, Mnova will include the peaks origin on each applicable peak label (very useful when if the spectra have two or more differents peak picking methods). You can see the result of use this script in the image below:
The annotations that Mnova shows in the peak labels are the following:
Manual Threshold (GSD): "Manual LSD" Manual Peak by Peak (GSD): "Manual" Manual Threshold (Standard): "Manual Standard" Manual Peak by Peak (Standard): "Manual" Auto Peak Picking (GSD): "Auto GSD" Auto Peak Picking (Standard): "Auto Standard" CRAFT peak picking via loading a table: "Auto CRAFT"
See also:
DEPT traces. See this tutorial to process Varian DEPT spectra
Purity Calculator. See this chapter
Set Central Frequency. It allows to set the center value of a spectrum by entering a value (in Hz) for f1 (in case of 1D spectra) or f1 and f2 (in case of 2D spectra). The last f1/f2 value used is remembered the following time you open the dialog (the first time the dialog shows the center value of the current spectrum). If several spectra are selected in the page navigator, the entered value is applied to all the selected spectra with equal dimensions.
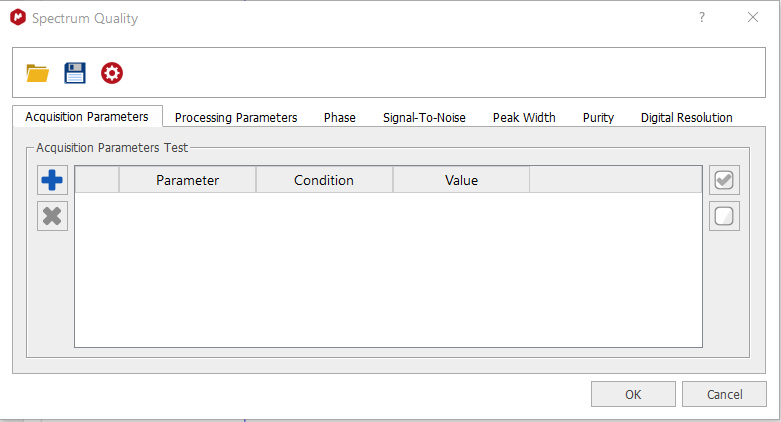
Spectrum Quality Assessor. There are many instances in automation where it is useful to be able to automatically check the spectrum quality before proceeding with automated analysis such as Verify, qNMR, SMA. This script call this "quality test" functionality. The script takes as input the chemical shift of the peak to be used for the tests (acquisition and processing parameters, phase error, half height peak width, signal to noise ratio, purity and digital resolution). If no peak is specified then the biggest compound peak in the spectrum should be used (respecting blind regions).
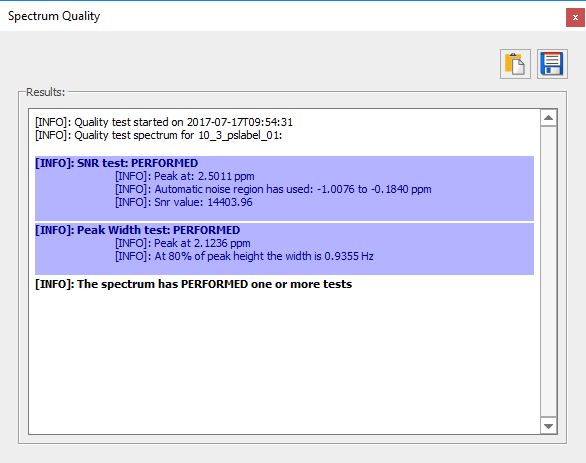
Finally, it generates and output with the results of each test:
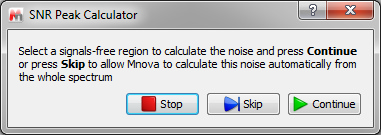
Signal to Noise Ratio Calculation To calculate the SNR. The script will get the noise level and then calculate the SNR by measuring the height of a peak and dividing this value by the noise level.
After running the script, it's necessary to select a signals-free region to calculate the noise and press 'Continue' (if you have not applied apodization, you could skip this step):
Next, select the region of the spectrum (or just a single peak) where you want to calculate the Signal to Noise Ratio. Once this is done, the program will populate the 'comment' section in the Peak List table with the SNR values.
The script to calculate the SNR needs to have two parameters: 1) The noise value 2) The peak intensity
Then it calculates the SNR using a ratio between those parameters: SNR = Y / noise;
Where Y is the amplitude of the peak and noise is the root-mean-square deviation calculated in a signal free area of the spectrum.
The noise value can be calculated either manually or fully automatically, as follows:
a) Manually. The user needs to select a 'signals-free' region' in the spectrum where the noise will be calculated according to this formula:
where: N = number of points of the signal-free region Yi = value of each digital point in the spectrum (real part) Ym = average of the digital points (real part) in that region
b) Fully automatic (which is different with Bruker); the user does not need to select any region of the spectrum.
With respect to the peak intensity, the script uses the peaks in this way: 1. If the user did a manual peak picking (or Peak by Peak or an automatic PP), the program will use those peaks in the zoomed region. 2. If the user did not applied any PP, the script will apply it for the user over the selected region using the automatic PP options.
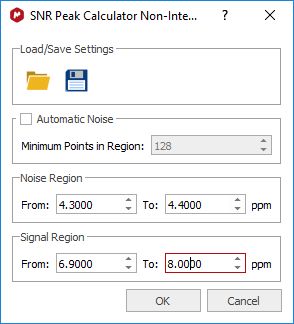
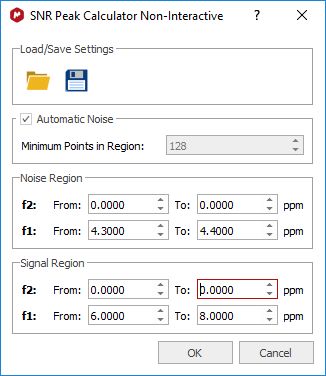
SNR Peak Calculator "Non interactive" This script will allow the user to select the noise region and the region of interest in order to get the applicable 'signal to noise ratio':
It can be used also for 2D:
Overlay/Stack Spectra You can 'stack or overlay' the selected spectra plots by clicking on the options "Overlay Spectra" and "Stack Spectra" available in 'Tools/NMR Tools' menu. The result will not be a real stacked/overlaid spectrum, instead of that, you will get the spectral windows stacked or overlaid, allowing you to freely move them up&down, as each spectrum will be an independent item:
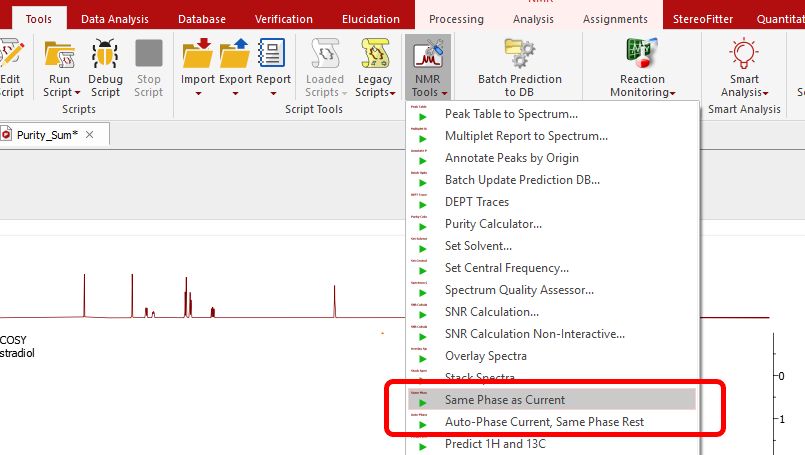
Scripts to autophase importing autophase stacked spectra when importing. Following the menu 'Tools/NMR Tools', you will find a couple of scripts to apply automatic phase correction to a stacked plot:
•Auto-Phase Current, Same Phase Rest: the active spectrum is automatically phase corrected, and the resulting values of PH0 and PH1 are applied to the other spectra in the stacked. •Same Phase as Current: PH0 and PH1 values of the active spectrum are applied to the other spectra in the stacked. •Set Solvent: it can be used to change the 'solvent' in the Parameters table in the case that the solvent is wrong or missing. You can select several pages in the same document and change the solvent to all of them by using this script.
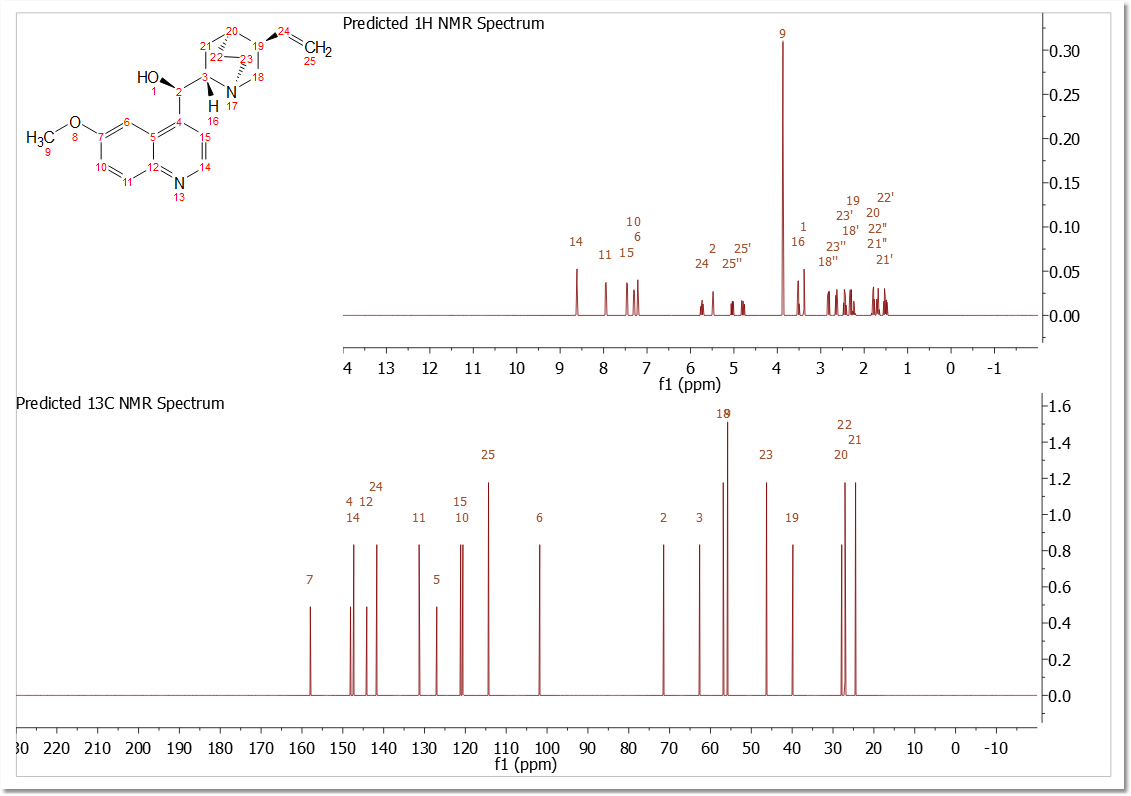
The script 'Predict 1H and and 13C' will generate a plot with both predictions from a given molecular structure (a license of NMRPredict Desktop is needed):
The script 'Auto Attach Traces' will automatically setup the 1D spectra as external traces of a 2D (all the spectra must be in the same document).
The script 'Make 2D DIAG NMR' will synthesize a 2D spectrum from a 1D experiment so that the latter will be the diagonal part of the 2D spectrum. It could be useful to obtain 2D pure shift spectra by using Indirect Covariance NMR. See this paper for further information.
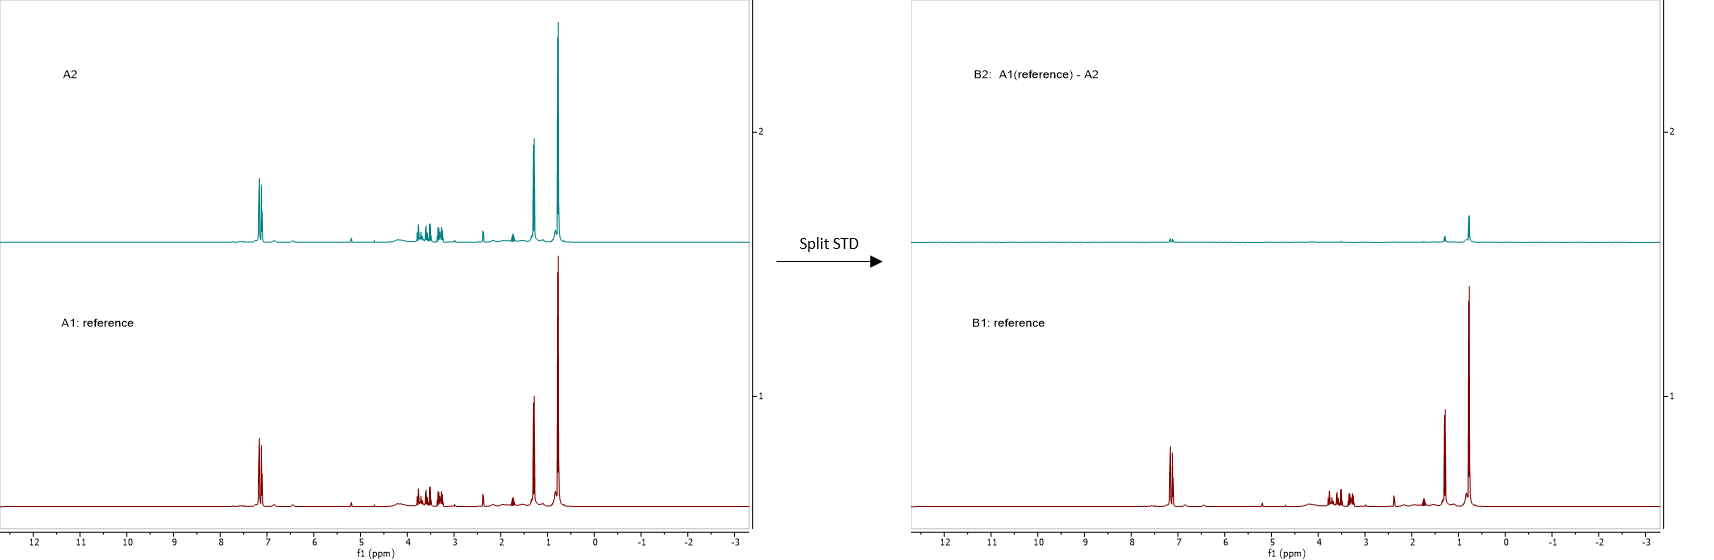
The script 'Split STD' will divide the Bruker pseudo 2D files (special kind of 2D with just 2 increments files) that their STD parameter set generates When running the script , you will be asked to select the reference experiment. The resulting stack will show the reference spectrum at the bottom and the difference between the reference and the other spectra in the stack:
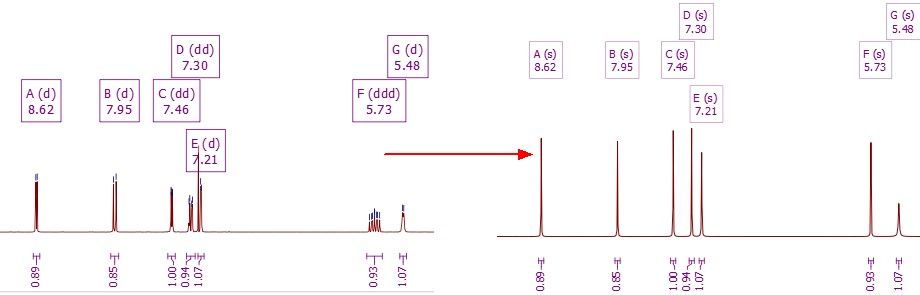
The "Synthetic Pure Shift' script will convert all the multiplets (with GSD Peak Picking) into single peaks (keeping the chemical shift and area constant).
The "Unfold 2D' script will be useful to assign an aliased/folded peak in a 2D spectrum. |