Multiplets Properties


Multiplets Properties |
|
|
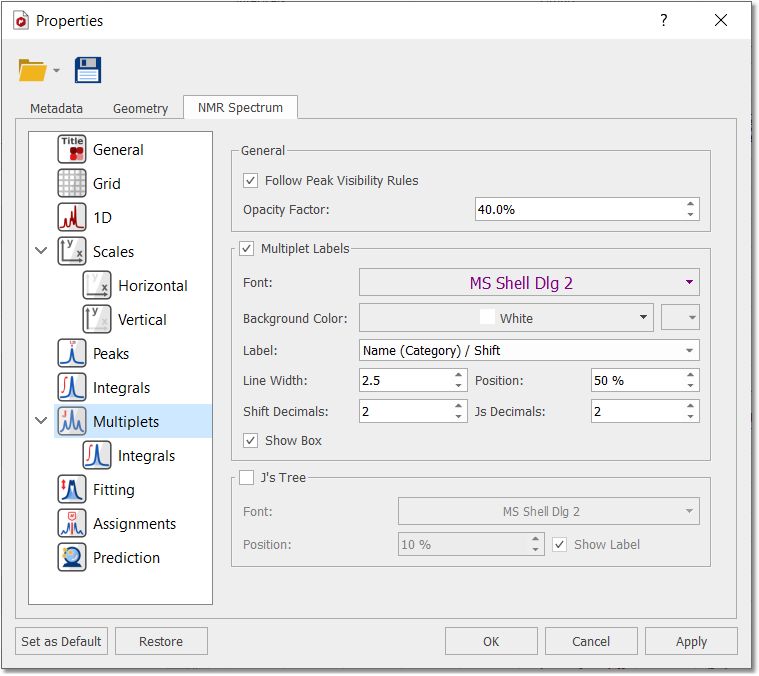
The user can modify the properties of the Multiplet Analysis by following the menu 'Home/Properties/Multiplet Analysis' or by double clicking the left mouse (or pressing the right mouse) button on the spectrum display and selecting Properties/Multiplets from the pop-up menu.
If the spectrum contains peaks belonging to more than one compound, we can show only the peaks assigned to one of them by filtering the desired peaks in the Peaks Table. Checking the 'Follow Peak Visibility rules' box will allow you to show only the multiplet boxes applicable to those visible peaks.
You will find an option to select the opacity factor for the non-compound multiplets (for the labels, integrals, j-trees and ranges) making them less visible than compound ones.
You can also select the color, line width, decimals for the shifts and coupling constants, the font and the margin of the 'Multiplet' boxes:
You can also hide the multiplet square box by unchecking the applicable box.
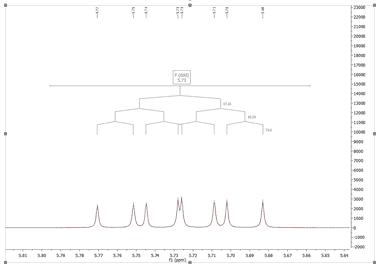
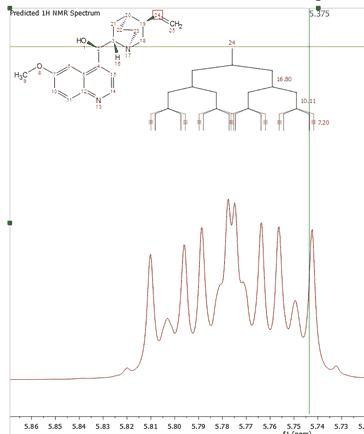
The user will be able to display the coupling constant tree just by checking the applicable option. Here you can see an example:
These objects are mouse sensitive in the case of predicted spectra, making possible the graphical edition of both the chemical shift and couplings by using drag & drop.
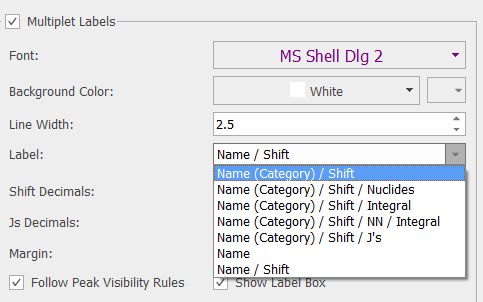
You can modify the information of the multiplet label by selecting the desired option in the scroll down menu:
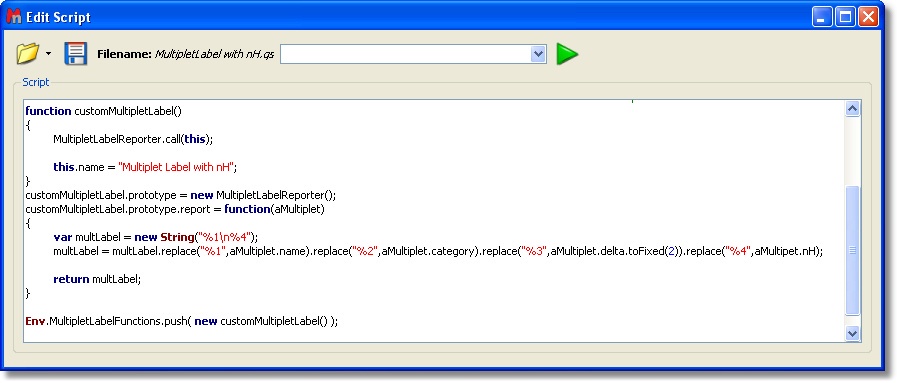
You can also add new labels by using the scripting feature. You will see below a script to show multiplet labels with the number of Hydrogens.
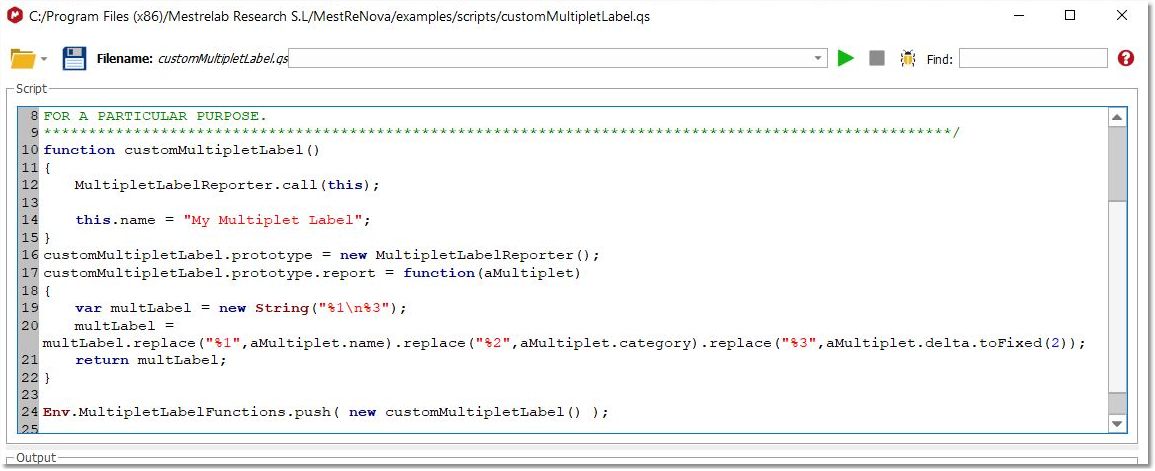
You will find another example (CustomMultipletLabel.qs) in the 'Examples/Scripts' folder of Mnova:
You will only need to save this script in a folder where Mnova can find it ('File/Preferences/Scripting/Scripts Directories) and after having restarted the software, you will get the new entry in the 'Multiplet Label' scroll down menu of the 'Properties' dialog box.
You can see in the Scripts chapter, all the multiplet properties which you can include in the 'multiplet label'.
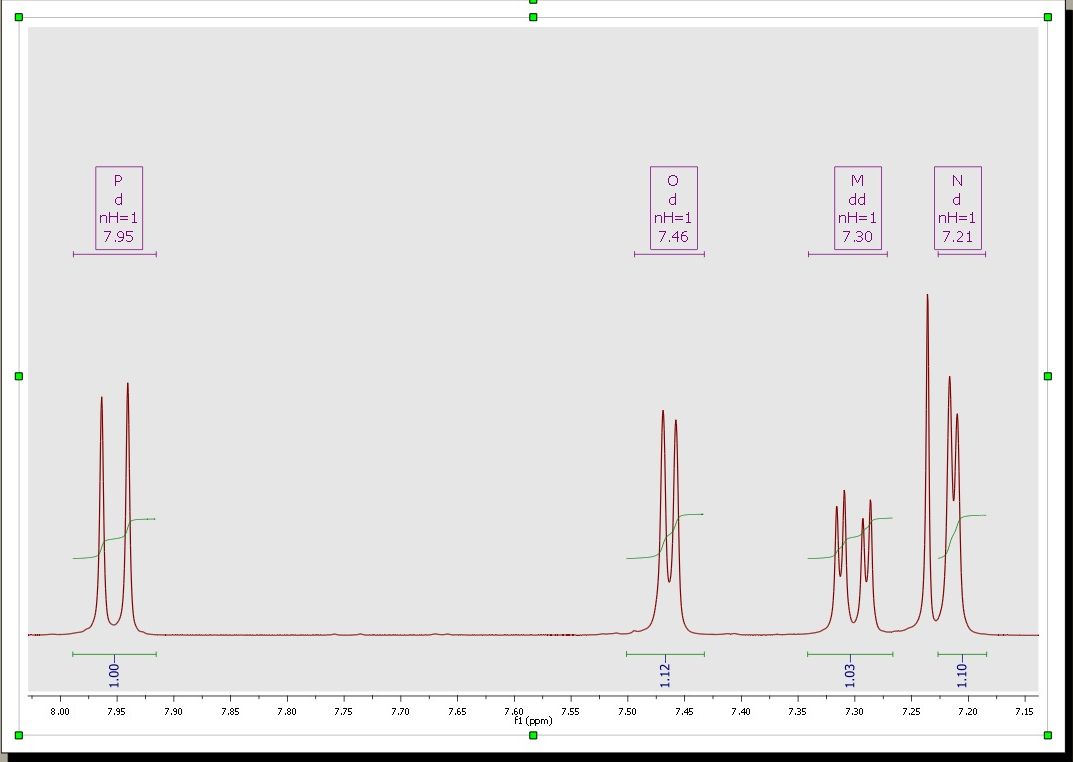
Adding the above script to the Mnova scripts directories, you will obtain your multiplet labels as you can see in the picture below:
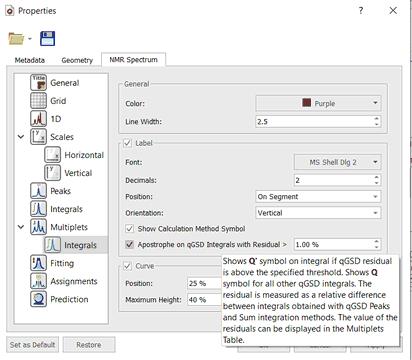
The user can also show the Multiplet Integrals Curves and customize the appearance. Please bear in mind that integrals and multiplets are two different list, so you can select what integrals you want to show (the 'pure integrals' or the integrals existing under the multiplet ranges):
From here, you can also display the integral calculation method and also to label those integrals with a residual bigger than a value.
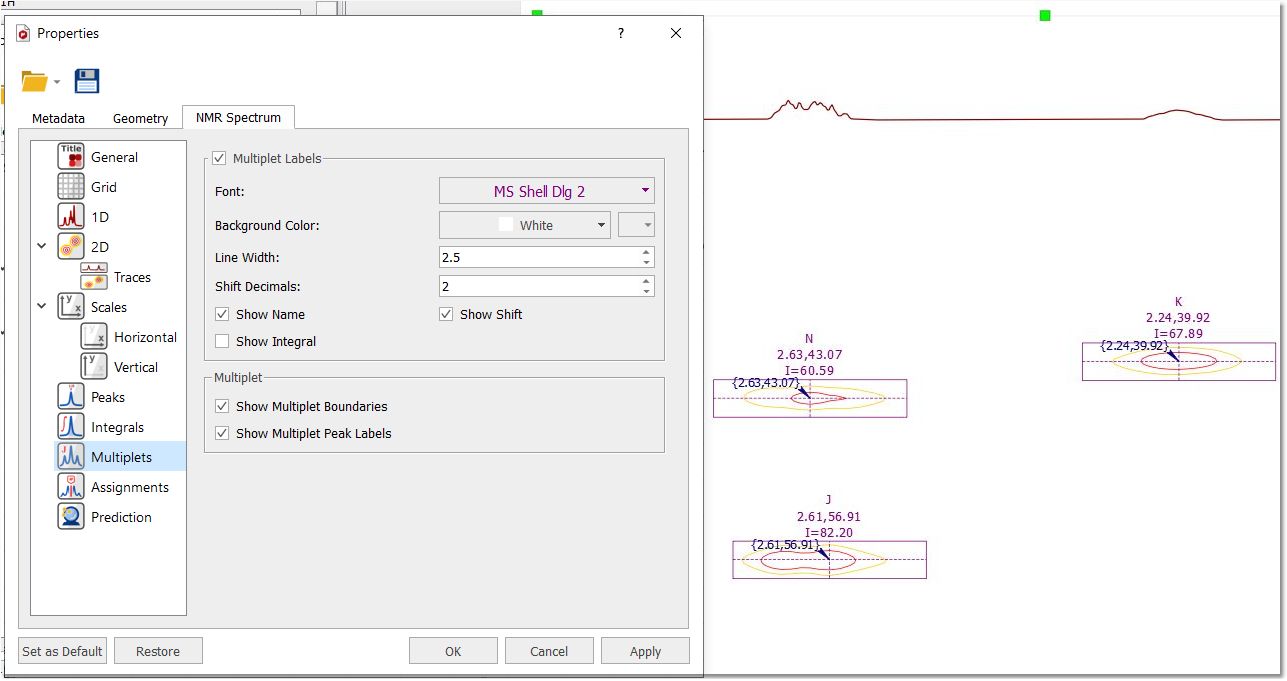
If you are working with a 2D dataset, the multiplets properties window will be similar and you will have the capability to change the font, color, line width, decimals, show name, integrals and shift values and multiplets and peak labels.
|