Working with the MSChrom plugin


Working with the MSChrom plugin |
|
|
Mnova MSChrom allows the user to navigate the TIC and display simultaneously any number of MS traces of interest, corresponding to specific points or to ranges in the TIC. All Mnova graphical functionalities (zooming, panning, create expansions, fit to height, increase/decrease intensities, etc) are available on all active spectra on screen. Spectra can be visualized in different modes: Standard, Peak spectrum, Background Subtracted Spectrum. Molecular structures (MOL files, SD files and copy/paste from ChemDraw, IsisDraw and ChemSketch) are also supported. The Mass plugin of Mnova supports the following formats:
•AB SCIEX Analyst •AB SCIEX Data Explorer (after having run DE software with admin privileges) •Advion •Agilent – ChemStation, MassHunter, Ion Trap •Bruker Compass •JEOL – MSQ1000, FastFlight, Accu-ToF 4G LC-Plus •MS CSV File •NetCDF ANDI-MS •Shimadzu LCMS, GCMS •ThermoScientific Xcalibur •Varian Saturn •Waters MassLynx •Waters OpenLynx Report •Waters UNIFI •mzXML, mzML and mzData (*.mzXML, *.mzML, *.mzData, *.xml) •PerkinElmer Files
Here you can find the list of supported MS formats by OS: https://resources.mestrelab.com/ms-supported-formats/
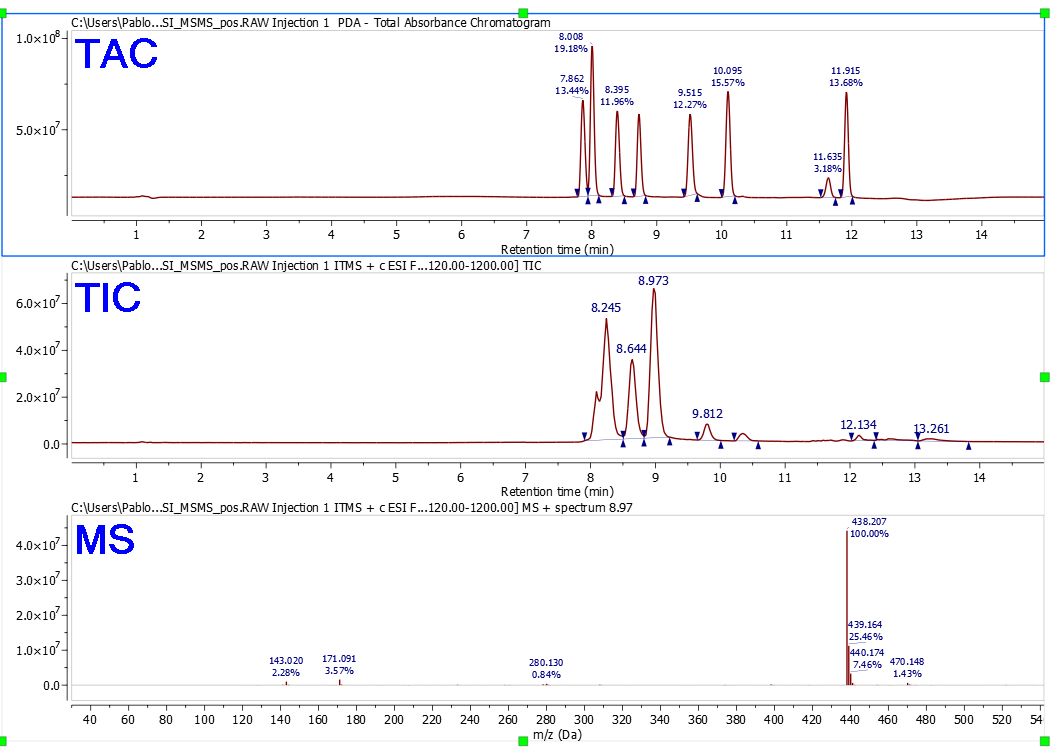
In order to load any sample in Mnova just Drag&drop the corresponding file to Mnova to display the TAC (at the top of the window), the TIC (in the center) and the MS spectrum of the highest signal (this default can be changed in the 'Preferences/Mass/Setup'). You can also use the 'File/Open' menu, the keyboard shortcut <Ctrl+O> (Cmd+O in Mac) or click on the 'Open' icon on the toolbar.
Double clicking on the spectral window will display the properties dialog box. From here you can modify the Grid, Axes, Line, Peaks and Title properties of the TIC and MS spectrum by selecting the corresponding tab in the dialog box. For further information about the Properties, please click here. You can expand any scale (in either the TIC or MS) by using the 'zoom in' feature, which can be accessed by just pressing the 'Z' key or by using the corresponding icon of the toolbar
You can select multiple chromatograms of the same dataset to zoom in/out simultaneously. The chromatograms can be selected as in a stack of NMR spectra:
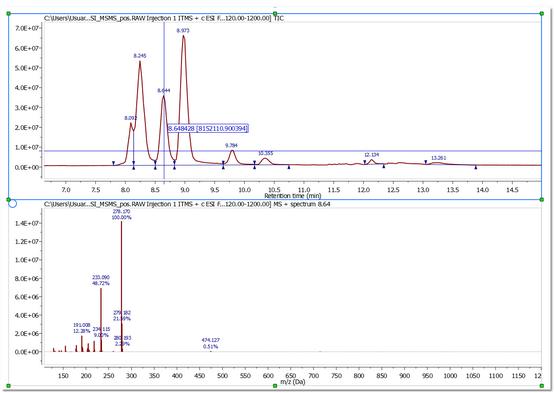
- To select a single spectrum, left click on the spectrum while keeping pressed the Alt key - To deselect a spectrum: left click + Ctrl/Cmd + Alt - In order to select multiple spectra, follow the same operation as above while keeping pressed Alt and/or Shift keys. You can select any other mass spectrum for a particular time point with the crosshair feature
NOTE: The "Live Mass Spectrum Preview" preference will allow you to show the extracted mass spectrum on the fly when you hover the crosshair over the chromatogram (or trace). |