T1 Analysis


T1 Analysis |
|
|
Let's see how to use the Data Analysis feature to calculate the T1 value of a 1H-NMR dataset.
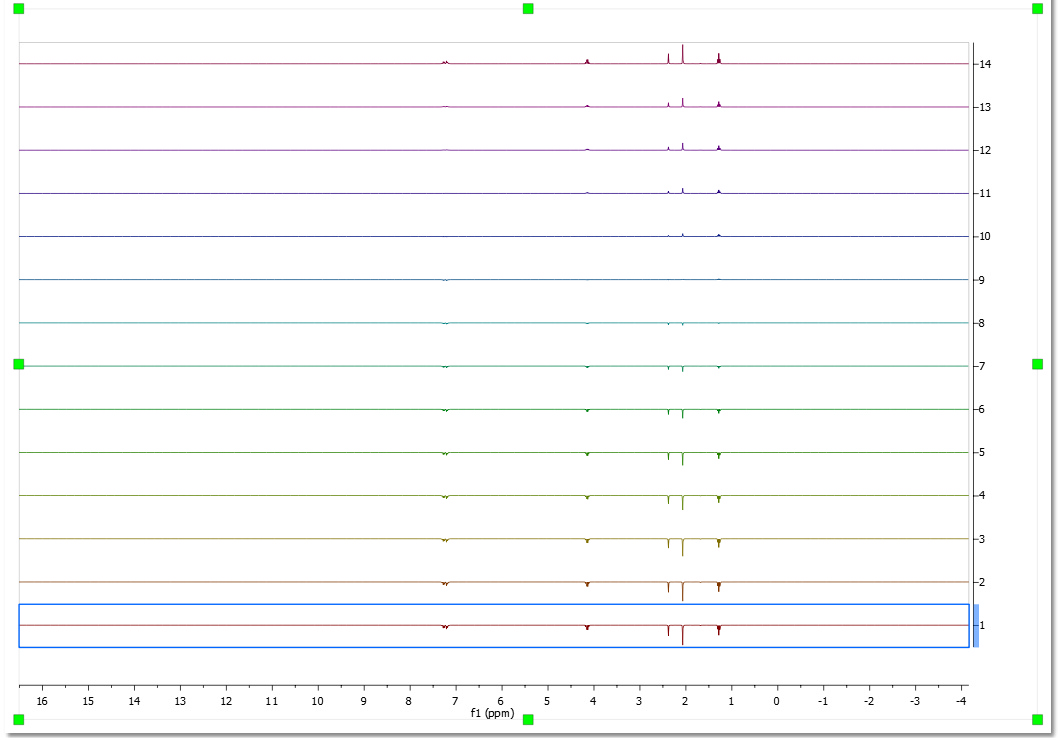
Firstly, load your dataset into Mnova and make sure that the phase is right (if not correct it by using the 'Manual Phase Correction tool):
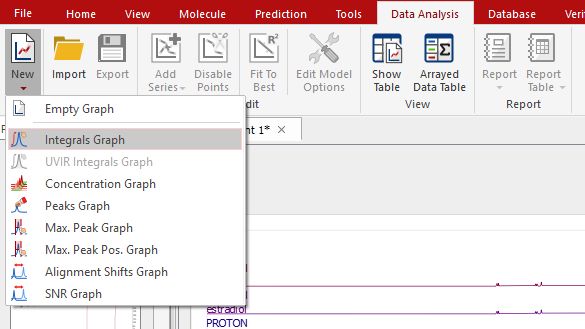
Follow the menu 'Data Analysis/New/Integrals Graph' and select the desired signal to analyze (i.e. the singlet at 2.38 ppm). You will notice how the graphical plot will be updated with the integral values:
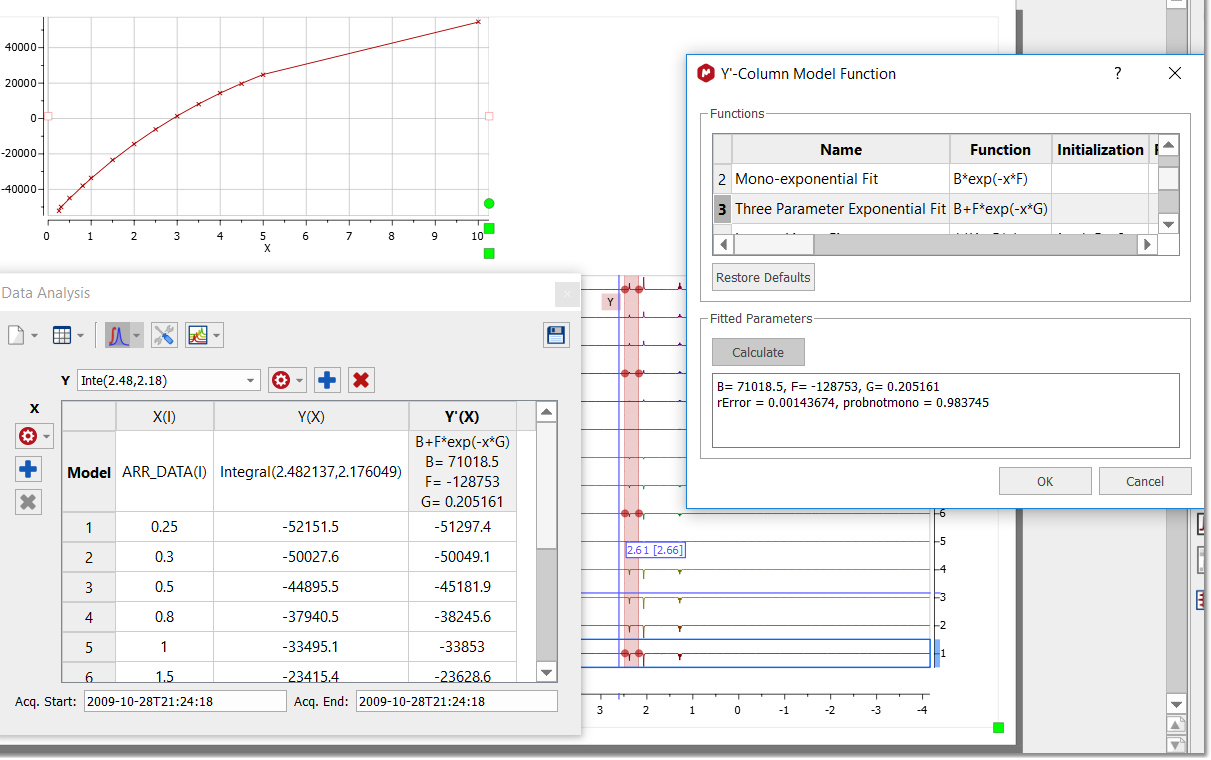
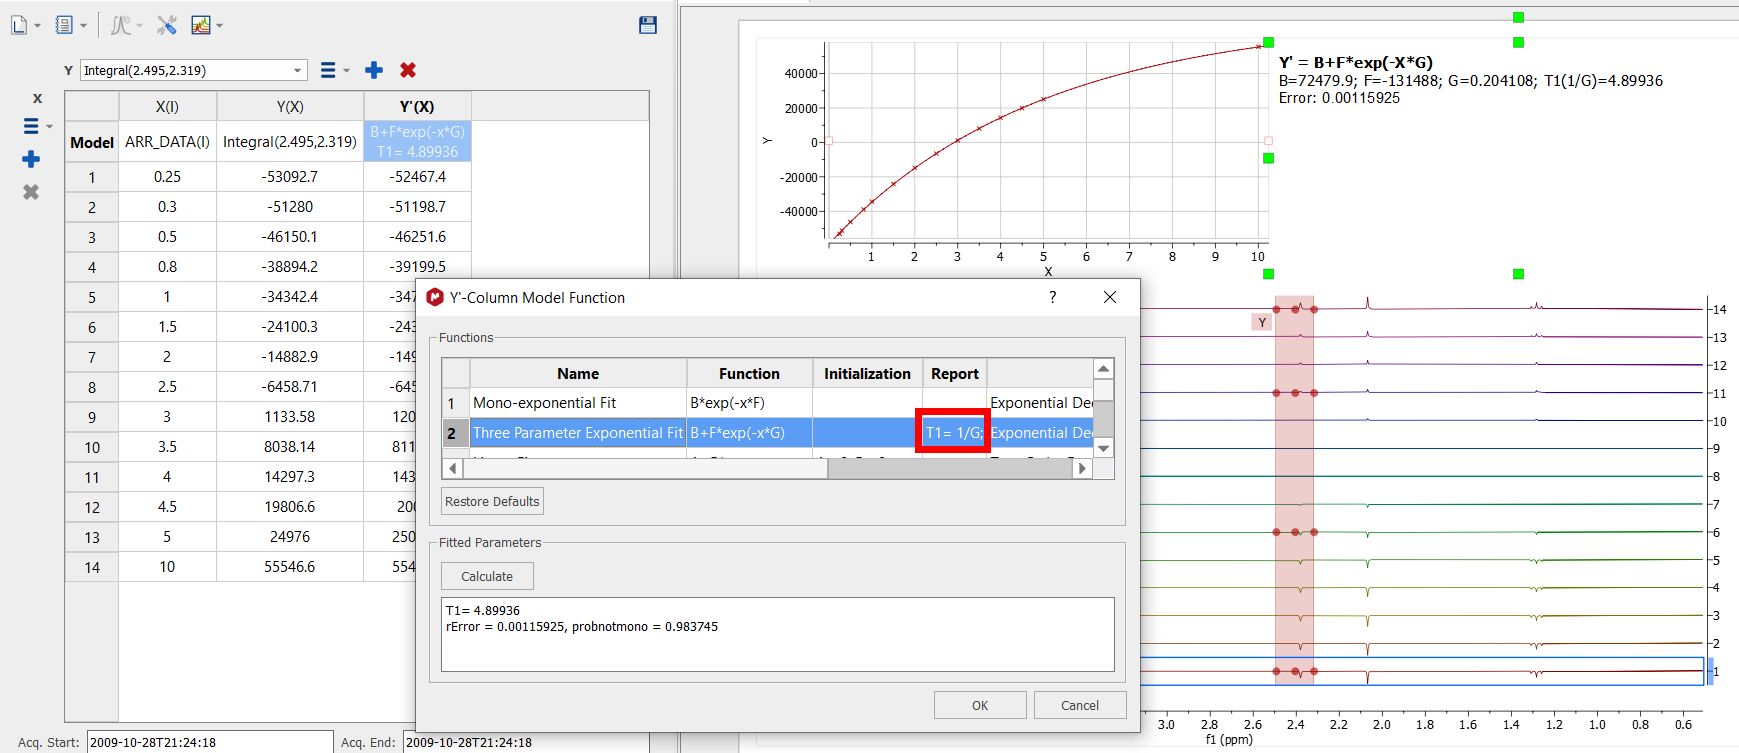
Finally double click on the Y'(X) cell, select the 'Three parameter exponential Fit' (B+F*exp(-x*G)) and click on the Calculate button
The T1 value will be the inverse of the G value, so in that case the T1 value for the proton at 2.38 ppm will be 4.90 seconds. Here you can see the result:
|