Data Analysis Properties


Data Analysis Properties |
|
|
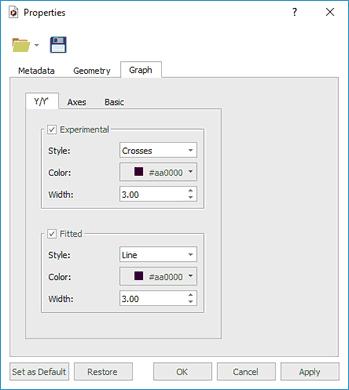
Modify the properties of the graphic representation, just by double clicking on it to display the 'Properties dialog box' which contains three labels (Y/Y', Axes and Basic). In the first label you will be able to change the style, color and width of the Experimental and Fitted lines
Selecting the Axes tab will allow you to change the color, font and margin of the axes and also to select the units scale (seconds, minutes, hours, points) and the capability to select Logarithmic values or to change the label of each axis.
Clicking on the Basic tab will allow you to change the background, the grid and also to show the corresponding legend. |