Single Mode


Single Mode |
|
|
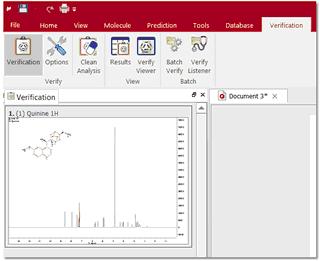
To run a verification in single mode, import into Mnova (by using the File/Open dialog or by dragging and dropping from the OS browser) a set of spectra (any combination of one 1H spectrum, one HSQC, 13C and one LCMS or GCMS) and a single structure (.mol or .sdf). Please note that our preference is to work with fid and ser files as opposed to processed data, as the optimal processing for the verification may differ from processing used for visualization, etc. Optimally, prior to running the verification, 1H NMR should be zero filled to 64K or 128K points and should have no line broadening applied. Once the data have been imported, invoke the 'Verification' menu.
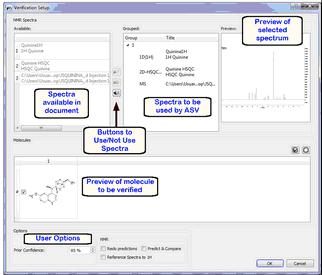
Once you have selected 'Verification'; the 'verification setup' dialog box will be displayed:
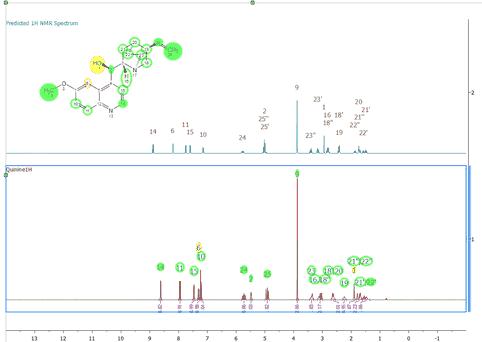
The document spectra panel displays the spectra which are available in the document. The verification spectra panel displays the spectra which will be used for the verification (you could have some more spectra in the document which you do not want to use for verification, so this allow you to use only those which are relevant to you at that stage) The spectral preview just shows you an image of the spectrum you have selected in the verification spectra panel (this could be handy when you are trying to decide maybe between 2 different 1H spectra to do the verification on) The buttons to Use/Not Use spectra allow you to move spectra which are available on the document to the list of spectra to be used for verification or viceversa. To do so, just select the relevant spectrum and click on the relevant arrow to move from the list on the left to the list on the right or from the list on the right to the list on the left. The molecule panel allows you to visualize the molecules you have available in the document and to select the one you want to verify by ticking it. The User Options do the following: Prior Confidence: If the prior probability is 0.5, that means that we don't have any prior knowledge about the quality of our structures so that the new score will be exactly the same as if the prior probability concept is not applied. Redo Predictions: to be used in cases where the prediction failed and the user manually corrected the values. See this chapter (example 2) for further information Predict and Compare tick box allows you to select how you want the spectra to be presented after verification. If you tick the box, you will be presented with the experimental and predicted spectra in a stack:
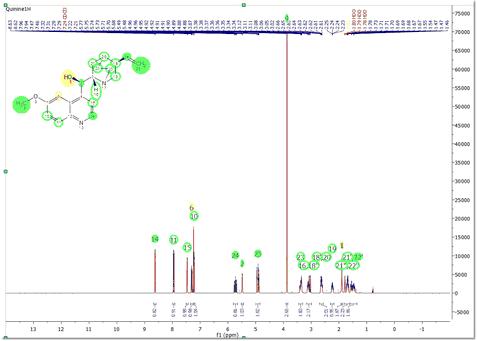
If you untick the Predict & Compare box, then you will be presented with just the Experimental spectrum:
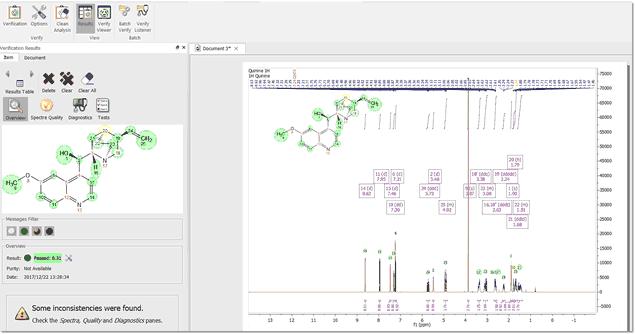
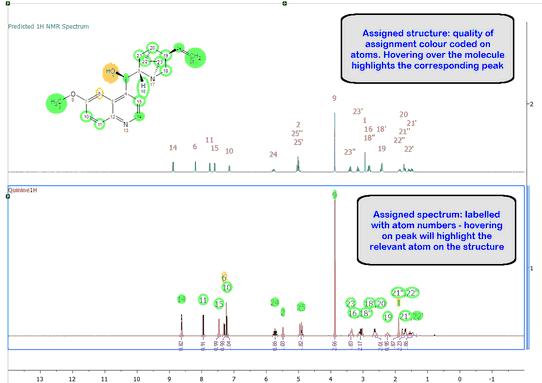
Reference Spectra to 1H: to apply Absolute Reference to the document Once you have selected the desired options, click OK and the verification will run. Once you have run verification, you will be presented with the following: 1.Spectrum/spectra, in your chosen view mode (Predict & Compare or Active) 2.A table of verification results which should appear after you run. If not, turn it on by using the ´View/Tables/Verification Results´ menu. 3.The structure, annotated with colour coded assignments.The color coding of the elementary assignments is made according to their quality (Green = High Quality; Yellow = Medium quality; Red = bad quality; Gray = worse quality). However, this quality parameter is not the only descriptor that we can use to show the outcome of a given assignment. There is another very useful parameter that is called ‘Stability’. A stable elementary assignment means that this remains stable in all the assignments solutions whose score is higher than a given positive threshold, that is, that assignment is found in all the assignments solutions. This is another way to say that such assignment is very likely to be correct. So the stable assignments are displayed as filled disks, whilst normal assignments are displayed with unfilled disks.
The paper area will present the spectra annotated with the assignments the software has made to the molecule and the molecule with each atom colour coded by quality of assignment (green is a good assignment, yellow is poorer assignment and red is a bad assignment but which still allows the software to make a total assignment of the structure).
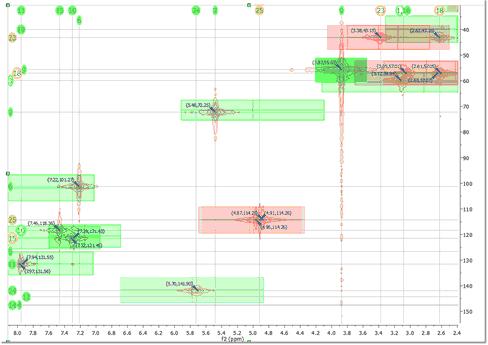
In the case of HSQC, the software will present you with the assigned molecule and assigned HSQC spectrum, with the assignment labels for the spectrum placed at the top of the paper. In addition, the spectrum is marked with colour coded rectangles as follows: -A green rectangle represents a predicted 2D range for a peak, which does have a real peak within it, therefore indicating a good match between experimental and predicted peaks. -A yellow rectangle represents a predicted 2D range for a peak, which has a real peak very close to its edge, therefore indicating an acceptable but less reliable match between experimental and predicted peaks. -A red rectangle represents a predicted 2D range for a peak, which does not coincide with any experimental peaks, and therefore indicates a significant difference between a predicted and experimental peak or the complete lack of an experimental peak. -A peak without a rectangle means that there is an experimental peak present where the prediction does not expect any peaks
|