Verification Results panel


Verification Results panel |
|
|
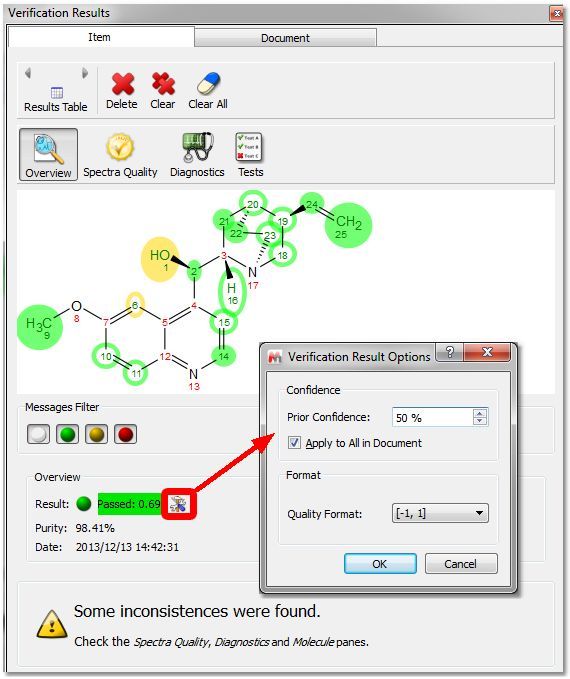
In the Verification Results table, the information is distributed in different pages (Overview, Spectra Quality, Diagnostics and Tests). The messages can be filtered depending on the type of inconsistency: In the Overview mode, we will get the result, purity value, date and the verification results options. From that dialog, you can change the 'prior confidence' to one spectrum or to all in the document (which can be useful for example if you had run a Verification with 100 spectra and then you want to see how the results would be with different prior confidence value, without needing to re-run the Verification) and also the quality format:
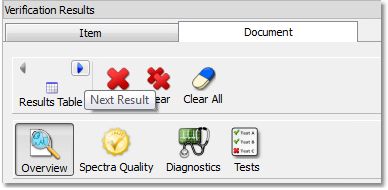
If the document contains more than on molecule, you can use the 'Result Table' arrows to navigate through the results:
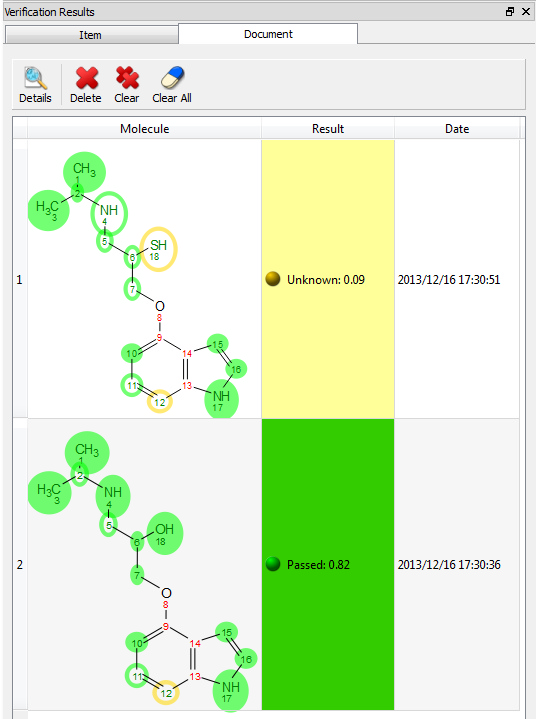
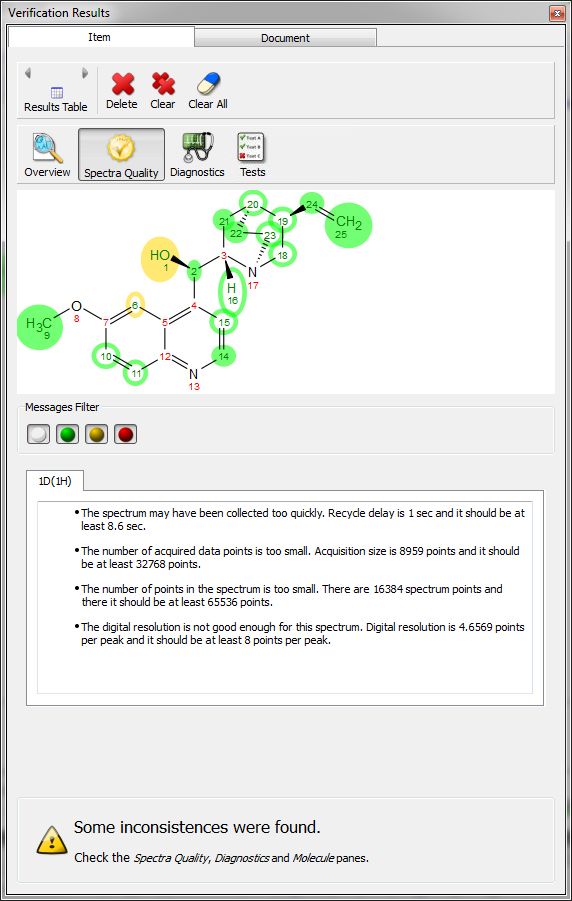
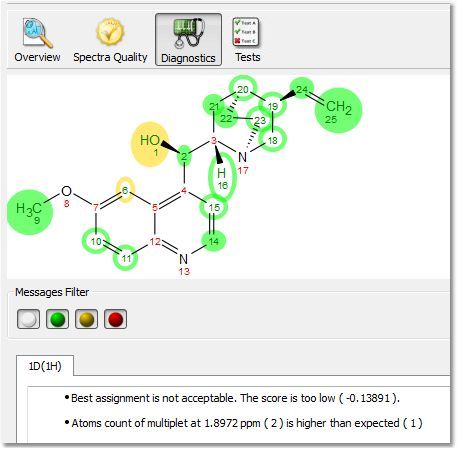
Clicking on the 'Results Table' button will display the verification results in a table: Clicking on the Spectral Quality button, will display the report any problem detected concerning the quality of the experimental data, which you can filter with the coloured buttons: Clicking on the 'Diagnostics' button, will display some warning messages:
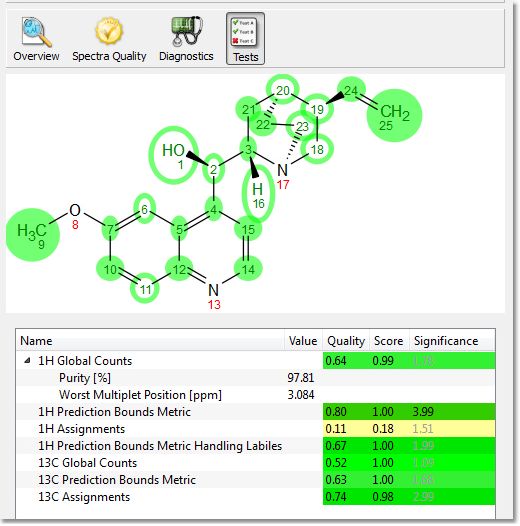
Clicking on the 'Tests button', will display the Score, Significance and Quality values for each individual test, which is designed to help you identify quickly possible reasons for a failure:
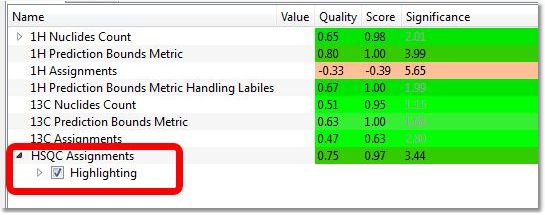
•Global Counts: Purity: this is an estimation of the purity of the sample calculated by NMR. Basically, it is the ratio of Compounds Vs (Impurity+Artifacts) peaks. Purity can be displayed in Peaks table by selecting the checkbox "Show Purity Label" in Setup Table (disabled by default). Worst Multiplet position: this is the location of the real multiplet which is furthest away on the chemical shift scale from its predicted counterpart •Prediction Bounds Metrics: this is the location of the predicted multiplet which is furthest away on the chemical shift scale from its experimental counterpart. Each atom in the molecular structure is given a chemical shift and an allowable range based on the quality of the prediction for its specific environment. The software then checks whether a multiplet with the right number of nuclides is present within that allowable range. There will be a specific test for multiplet labeled as labiles by the Autoedit analysis step. •Assignments Test: Effective number of missing peaks and effective number of extra peaks (1H, 13C and HSQC). The full spin system for the proposed molecular structure is built and compared to the experimental data. Every possible assignment of the multiplets in the spectrum to the spin system (and through it to the atoms) is enumerated and its likeability calculated by a merit function. The highest positive result of the merit function will be reported as both as verification test result and as automatic assignments made on the structure/spectrum pair. In the case of HSQC, the 2D spectrum for the structure is predicted and each predicted peak is given a 2 dimensional allowable range. Each of these ranges is then evaluated as to whether a real peak in present within them, and whether there are ranges with missing peaks or real peaks which do not correspond to allowable predicted ranges. When running the verification of a HSQC against several molecules, the user has the ability to show the rectangles in the HSQC for each molecule, by selecting the molecule from the ASV Results table and checking/unchecking the 'Highlight' box for the HSQC assignments in the table:
•MS Molecule Match Score: For each proposed structure’s molecular formula, with the given ionization mode (such as protonation), a molecular ion cluster spectrum is computed. Each molecular ion cluster spectrum is then compared to every spectrum in the LC- or GC- MS run, and ranked according to spectral similarity, where 1.0 is identical within the m/z region of the molecular ion cluster. This ranking is further refined by taking into account the response of a molecular ion chromatogram (or chemical chromatogram) , which also has a maximum value of 1.0. The final match score is the product of the two metrics. The MS Molecule Match similarity measurements are derived from traditional dot product calculations and take into account a user specified m/z accuracy, to make full use of accurately mass measured mass spectral data. If MS/MS spectra are also present in the data set, the structures are used to predict fragment spectra, and these predicted fragment spectra are compared with the acquired MS/MS spectra. Once the data is processed and made ready for the verification, a series of tests of the hypothesis that the proposed structure is the major component of the sample are carried out. For an effective automatic structure verification system when many of the parameters being considered by it may well be imperfect (integration, spectral analysis, predicted chemical shifts, etc.) it is fundamental that the system has the capability to weigh different results in different ways and to auto-evaluate the importance of specific tests in specific conditions. This allows the system to become robust to a level of uncertainty in the quality of the inputs. Therefore, the single tests may have not only a score but a different significance which, in addition, may correlate with the principle outcome. Each test generates a [quality, score, significance] result: -Quality: The Quality Score corresponding to each individual test is generated by combining the Score and the Significance for that test. The objective of this Quality Score is to generate one single number to allow easy comparison when handling large volumes of data. The format of Quality values can be selected from 'Verification Results table' after having clicked on the 'Options' button:
-Score: This is the result of the test, where a value of 1 means that the hypothesis fits perfectly with the experimental data, whilst a score of -1 means that the hypothesis is a perfect failure and therefore definitely wrong. The score value will include three digits (Score taking into account the prior confidence, verification score (without taking into account the prior confidence) and 'prior confidence') -Significance: Each test, depending on the characteristics of the data, the proposed molecular structure, the prediction quality for the given HOSE codes or chemical environments present on the molecule, etc., gets given a significance. Thus, a high level of impurities in the spectrum may reduce the significance of tests which rely heavily on integration, whilst a poorly predicted chemical environment may reduce the significance of a test relying heavily on chemical shift prediction. Significances of 0-2 are low, 3-5 are medium and >5 are highly significant. There is no theoretical limit to the value of significance, if a test could be devised which was fully deterministic and completely infallible, this could have infinite significant within this concept. |