Selecting Regions


Selecting Regions |
|
|
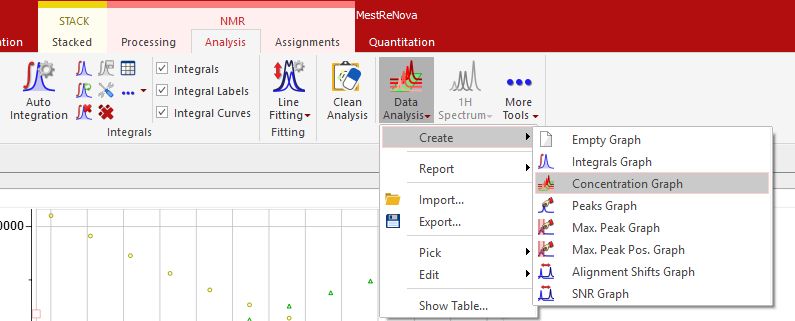
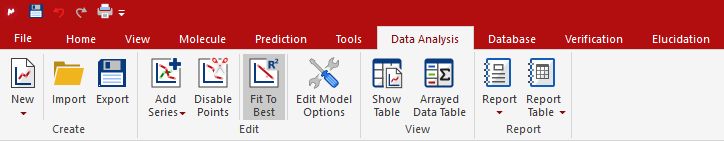
Once you have imported your datasets, you can select the 'Reaction Monitoring' regions of interest by following the menu 'Analysis/Data Analysis/Create Concentration Graph' to select the desired regions:
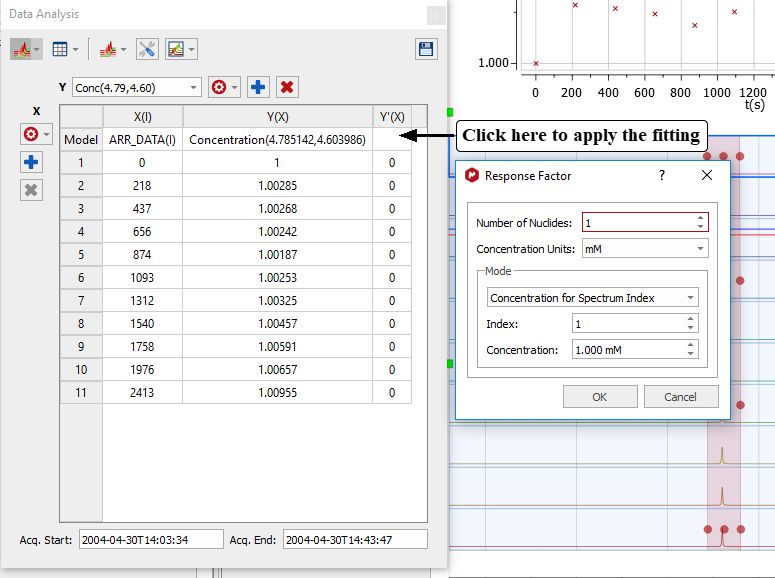
Once you have selected the first region in your stacked plot, you will be asked to type the number of nuclides and concentration value. Once you have typed the values, the Data Analysis panel will be filled.
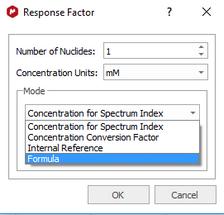
You can select different modes: Concentration for spectrum Index (by area of peak of the selected spectrum in the array), Concentration Conversion factor (CCF), Internal Reference (to include a reference compound of constant, known concentration) or to use a Formula:
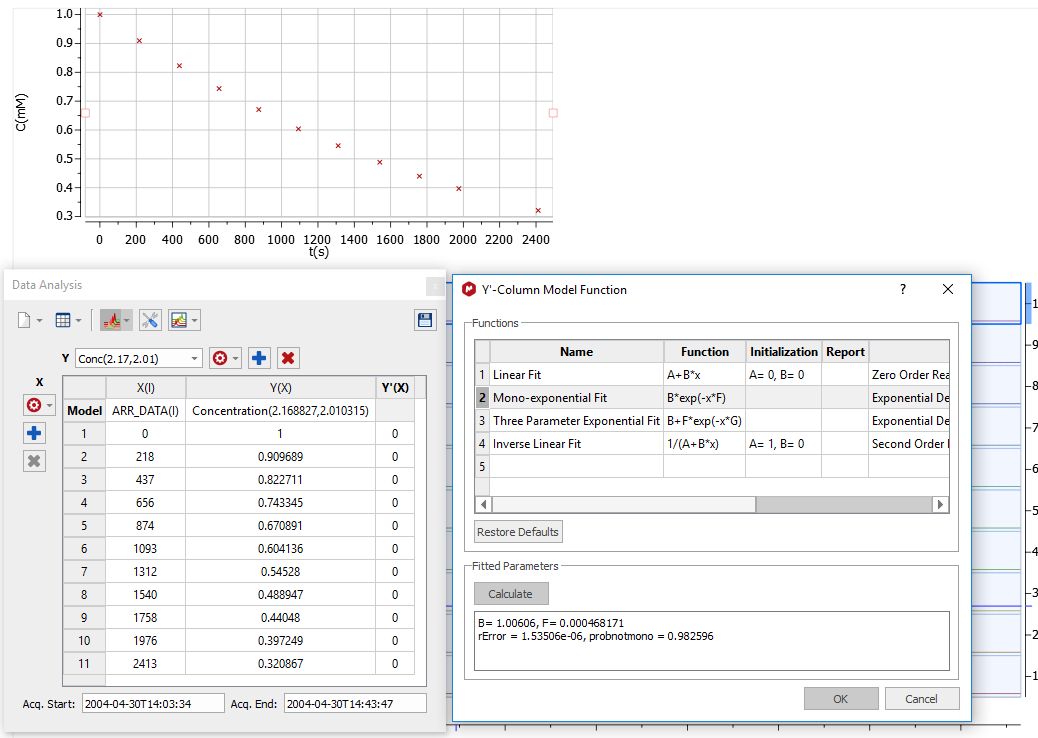
Next click on the '3 dots' button of the Y'(x) column to select the desired fitting (Mono-Exponential in the picture below). Next, click on the 'Calculate' button to generate the parameters of the fitting and finally click on the OK button to draw the fitting curve.
Follow the menu ' Analysis/Data Analysis/Edit/Fit to Best' and Mnova will try to guess the order of the reaction; fitting the data to standard equations and comparing the mean square error:
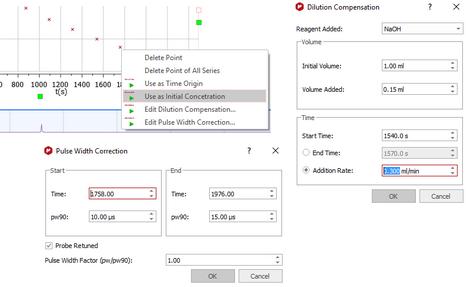
With the Reaction Monitoring plugin enabled, if you right click on any point of the Data Analysis Graph (or Table), you will be allowed to 'use that point as time origin or as 'Initial Concentration', or to set the Dilution Compensation Parameters' and 'Pulse Width Correction':
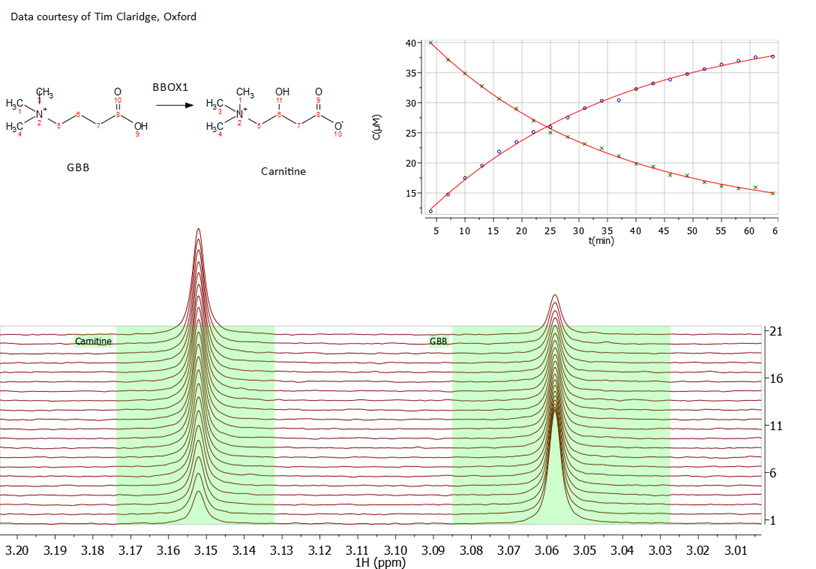
Here you can see an example following an enzymatic reaction:
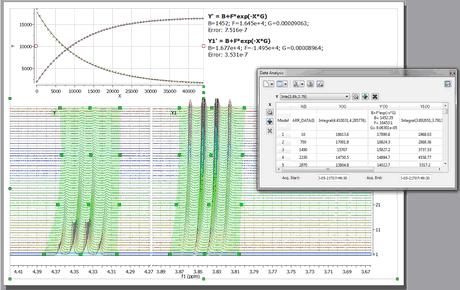
and here an ester hydrolysis:
|