Importing Datasets


Importing Datasets |
|
|
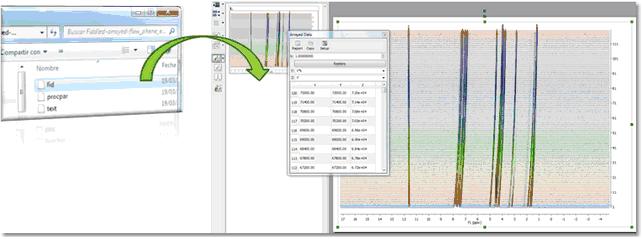
Importing of R-M data sets acquired in arrayed mode If your dataset has been acquired in arrayed mode, it will be enough to drag&drop the FID (Varian) or SER file (Bruker) to Mnova.
Mnova supports, in addition to Reaction Monitoring, Relaxation (T1/T2) and PFG (DOSY) experiments (in other words, it will parse the arrayed parameter automatically).
In either case, Mnova will automatically read the values of the arrayed parameter, e.g. time stamp and populate the corresponding arrayed data table
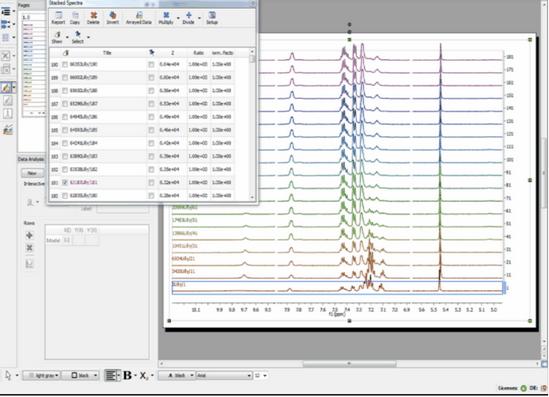
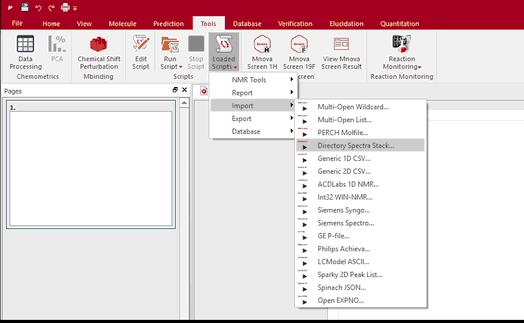
Importing of R-M data sets acquired on individual basis Mnova includes a powerful script which makes it possible to import all spectra contained in a folder and automatically stack them for forthcoming R-M analysis. This script is under the Scripts menu and it is called ‘Directory Spectra Stack’. It will allow the user to select the directory where the spectra are contained. Then Mnova will open and process all those spectra (FIDs) automatically in bunches of 20 spectra and finally will stack all of them.
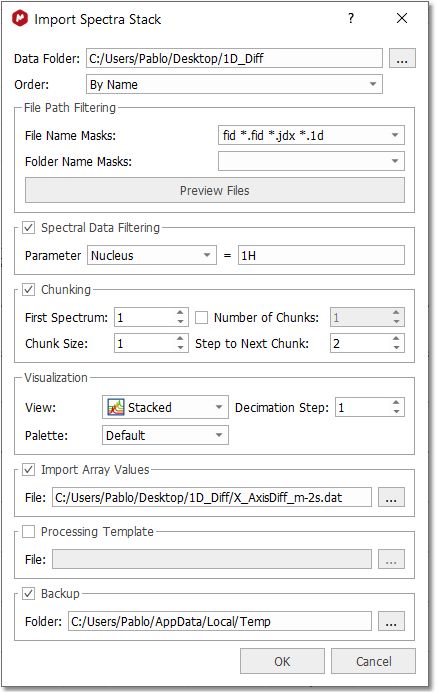
Note: This script has also the option to decimate the spectra while loading (i.e. the program can skip every 10 spectra in the data set) and to apply a processing template (or to load the 1r processed data):
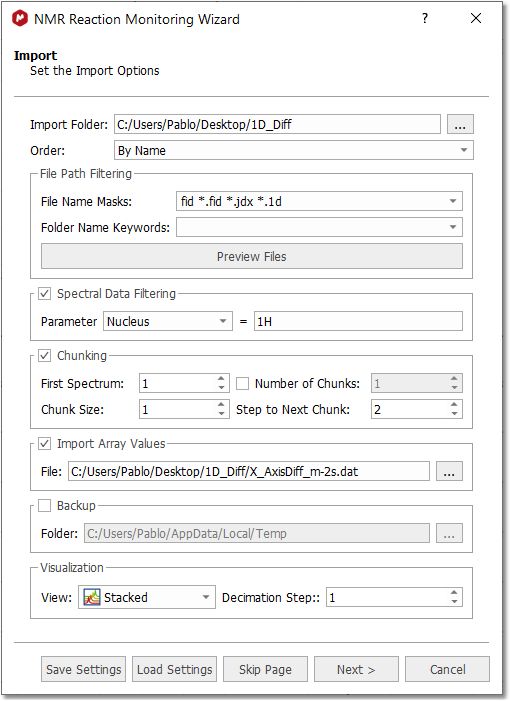
Reaction Monitoring Wizard This wizard is a simple way to quickly get Reaction Monitoring data into Mnova and analyse it. It will allow you the save and recall procedures in the future.
In the screenshot below you can see how to select the directory of your dataset, to sort the spectra by name or date, to display them in stack or superimposed mode and to use decimation.
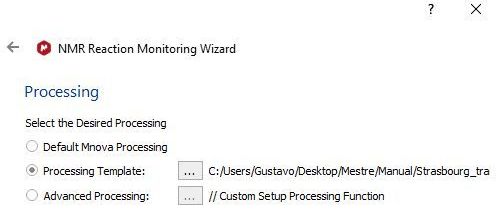
You can also 'Save or Load Settings' from this dialog box. Clicking on the 'Next' button will display the dialog below:
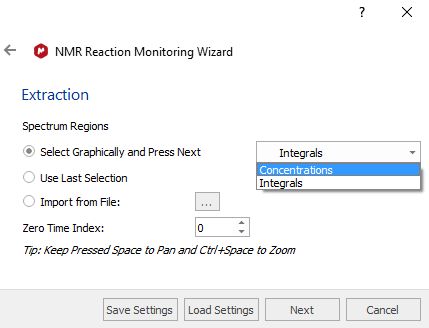
This new window will allow you to apply 'processing templates' to your datasets. Clicking on the 'Next' button will display the 'Extraction' dialog:
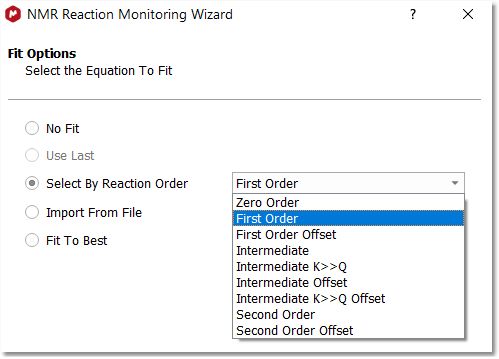
From the dialog above, you will be able to select graphically the regions (with concentrations or integrals), import a XML file with the regions of interest or use the latest selection. From here you can also select the Zero Time Index. Clicking on the 'Next' button will display the 'Fit Options' dialog:
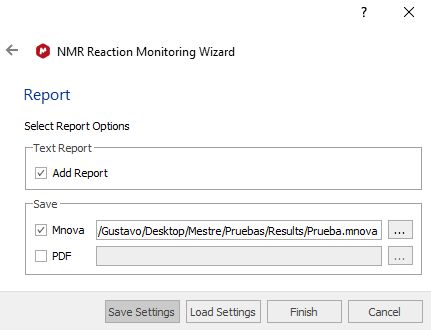
Finally, click on the Next button to display the Report dialog box which will allow you to save the document in Mnova or PDF format:
See also this video
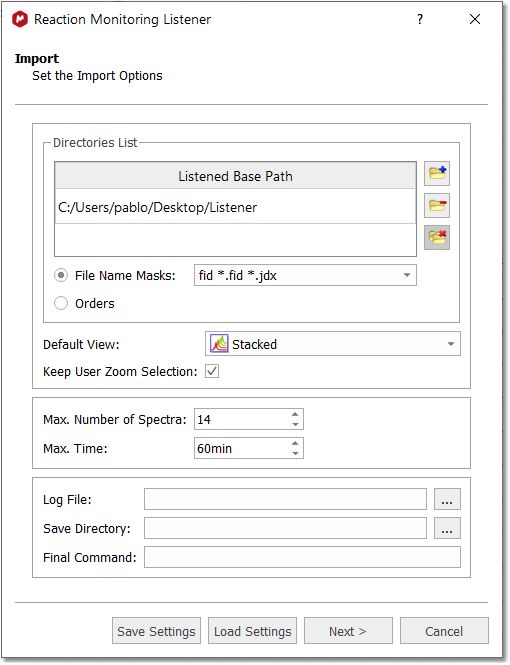
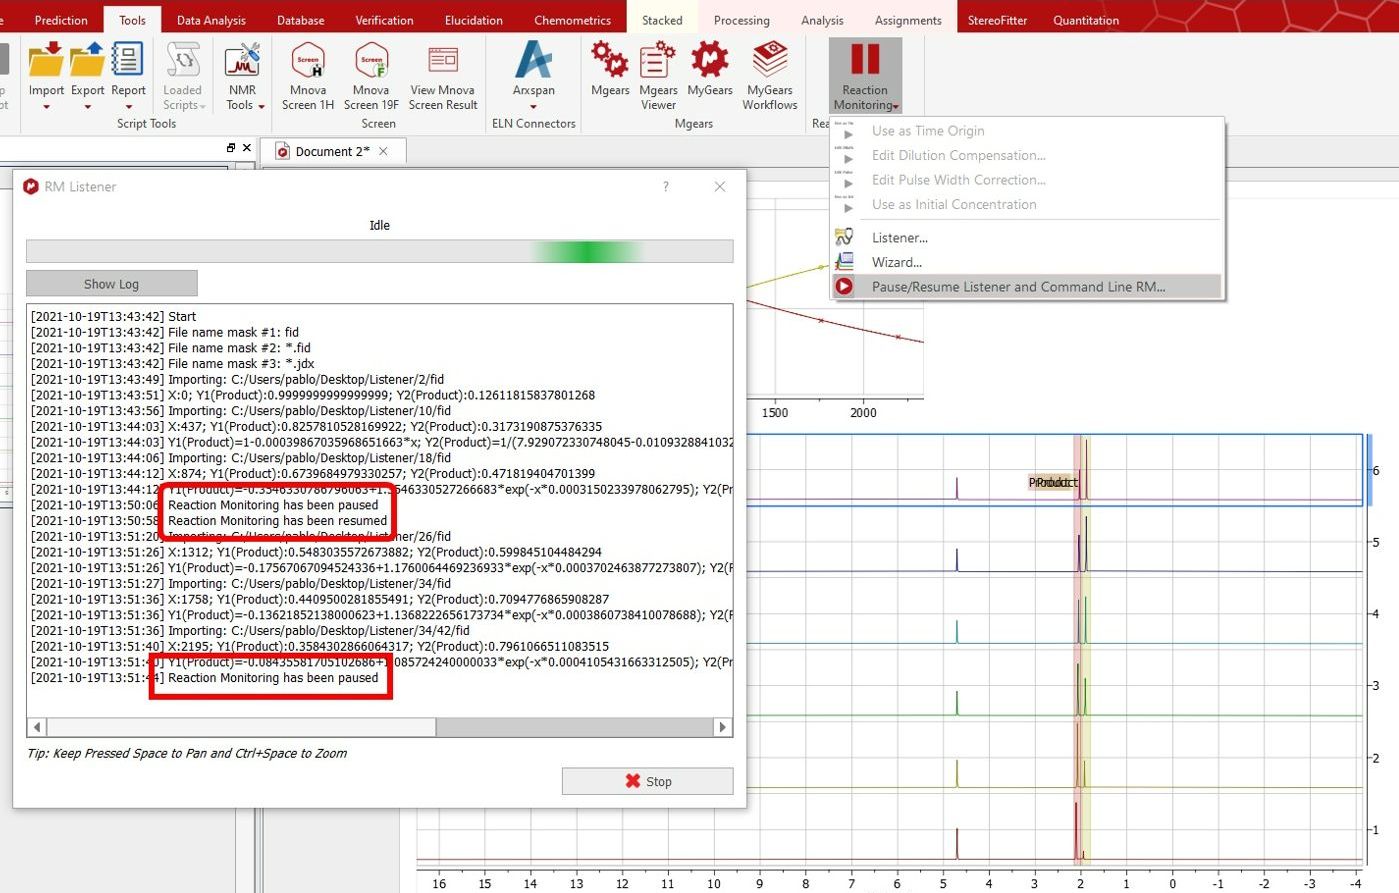
Reaction Monitoring Listener: The listener will automatically import, stack and save any dataset that arrive to the selected folder according to the selected file masks:
You can define a default view (stack or superimpose), keep the zoom selection (by checking the applicable box) and select a maximum number of spectra or time.
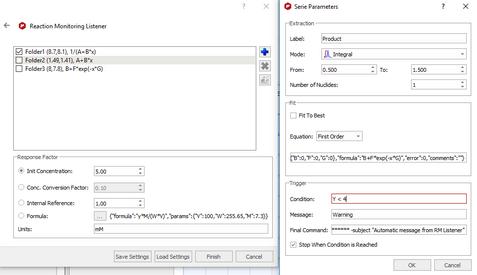
You can also use a final command to get whatever you want. For example, to receive an email when the listener stops completely, because all the conditions has reached. You can define a final command when an specific condition has reached (but not necessary all of them).
In the example below, we have used the application 'blat exe' to send an email when a condition in a serie has reached. The initial concentration was 5 mM. After the condition is reached (when concentration is lower than 4), the listener stops, shows a message of "Warning" and an email is sent. (the final command used was: c:\temp\blat.exe -body "Condition reached" -to support@mestrelab.com -u guest@mestrec.com -pw ****** -subject "Automatic message from RM Listener" )
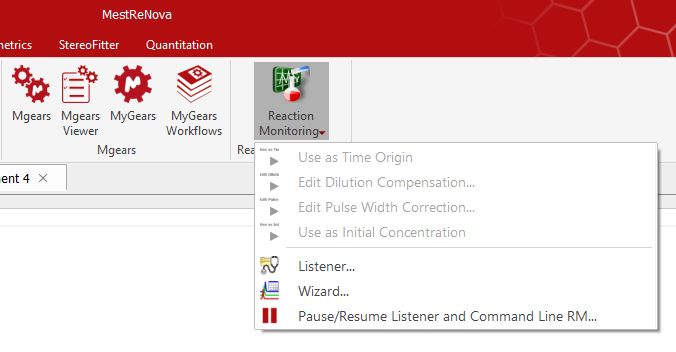
There is a button in the ribbon which will allow you to pause/resume the listener (and the command line tools), very useful if you are interacting with the stack whilst the listener is running:
|