Practical Example


Practical Example |
|
|
This tutorial will show you how to use the Reaction Monitoring plugin for your spectra.
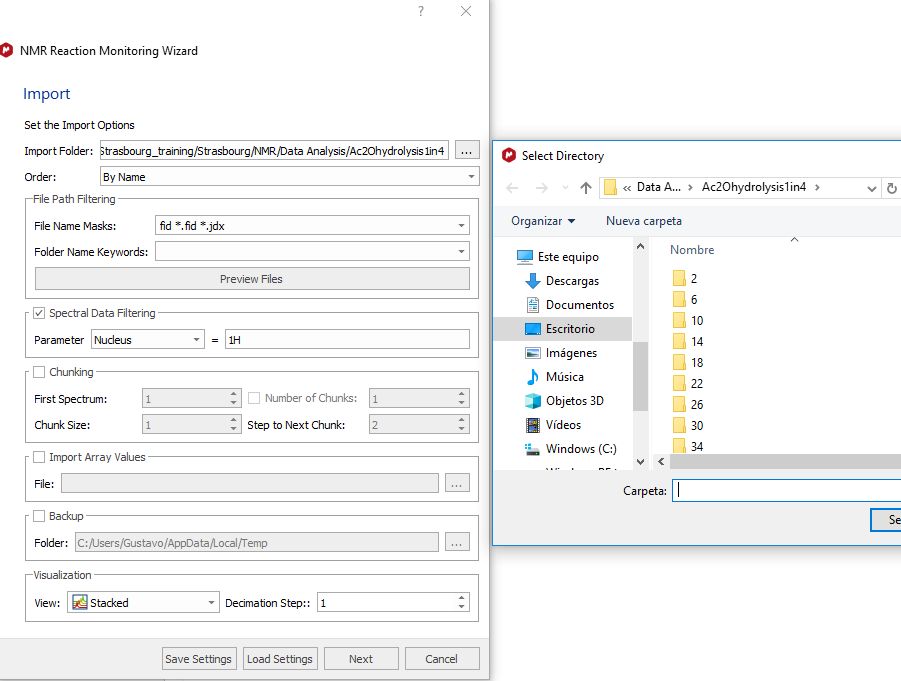
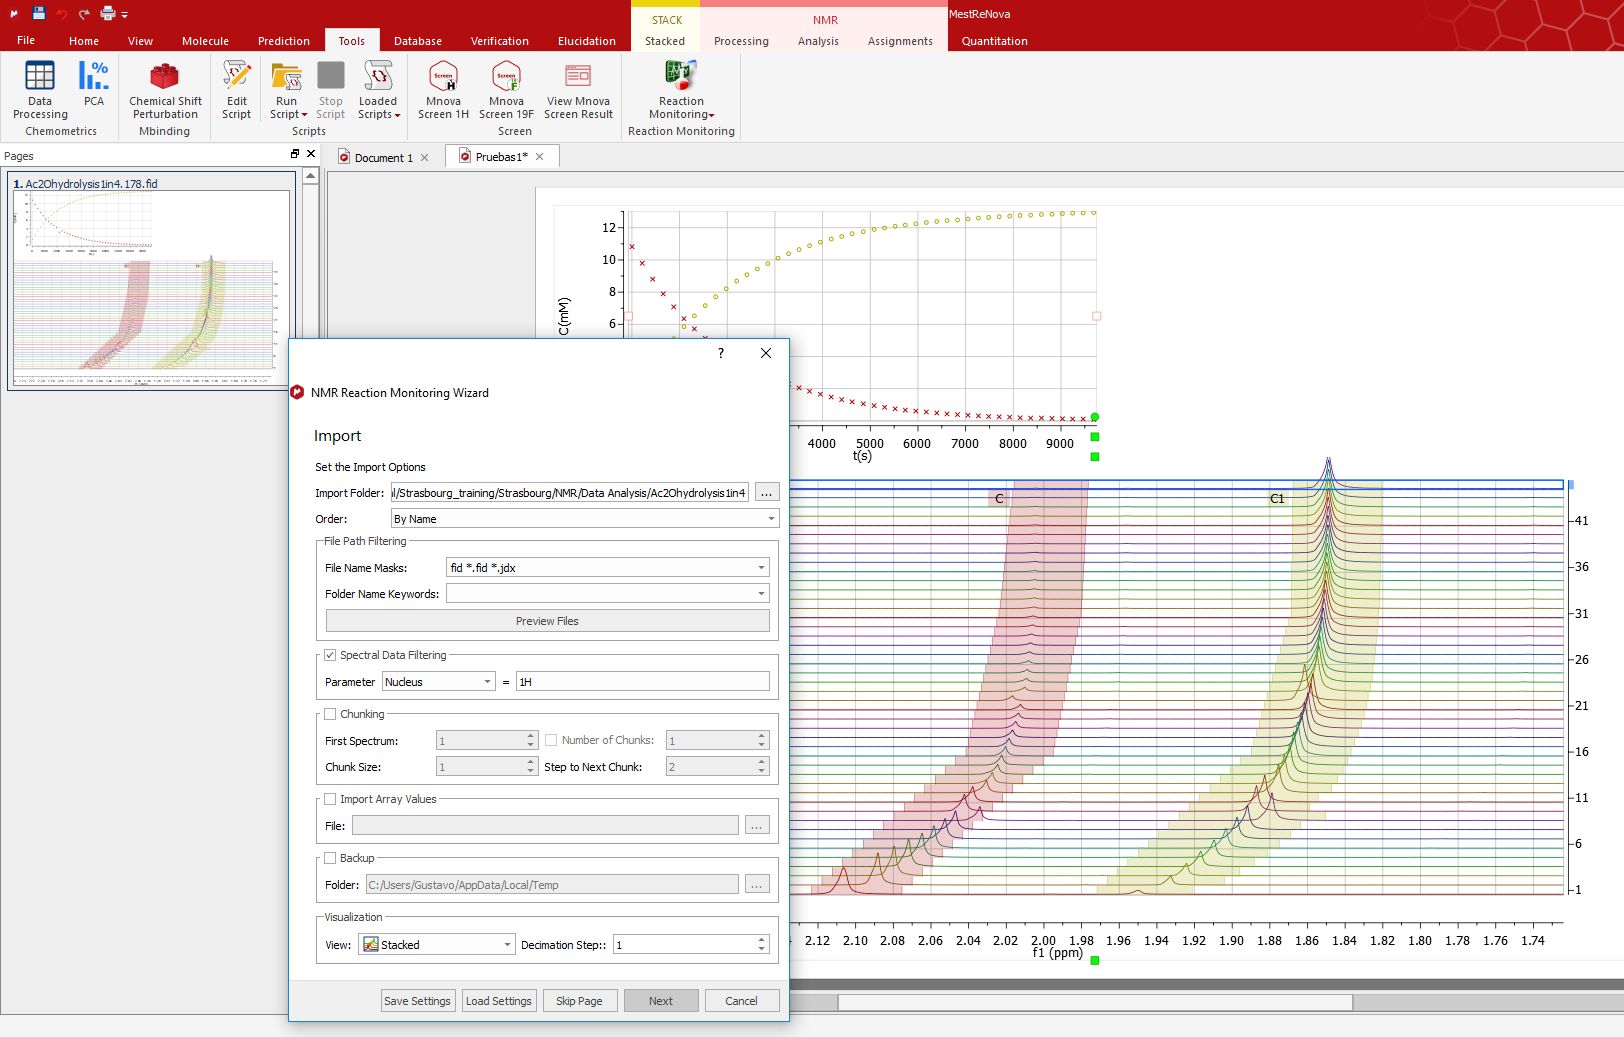
You will need to import your dataset into Mnova just by dragging and dropping the stacked spectra (if it has been acquired in arrayed mode) o by using the Reaction Monitoring Wizard (Advanced/Reaction Monitoring/Wizard) if the datasets have been acquired on individual basis (you can also use the Scripts/Import/Directory spectra Stack).
In this tutorial we will use the RM Wizard. You can download the dataset from this link.
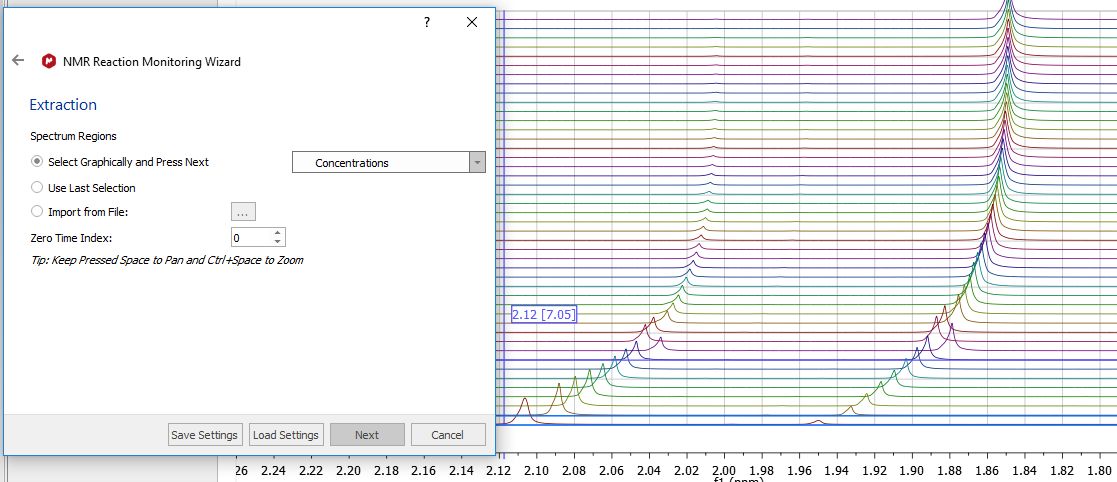
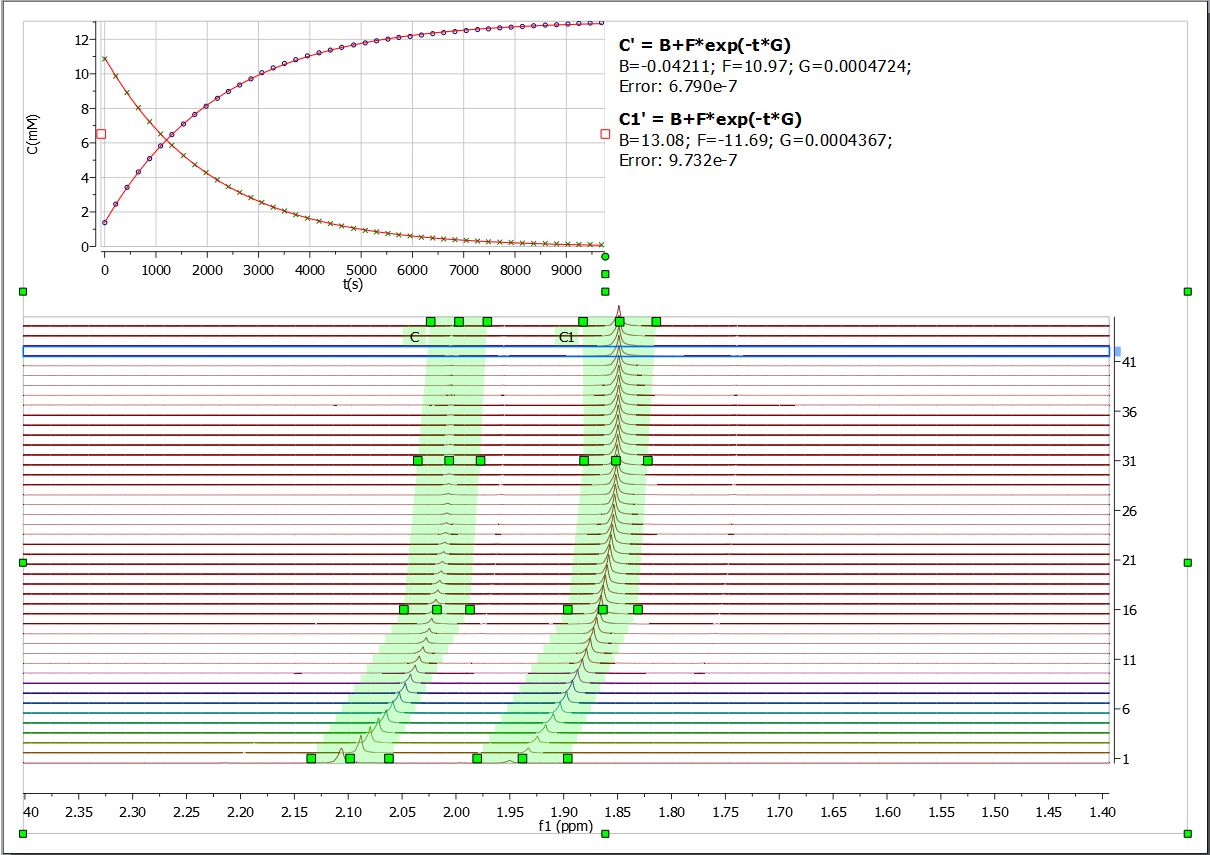
Once Mnova has loaded all the individual spectra, it will show you the stacked plot. Zoom in (by using 'Ctrl+Space' (or Space+Cmd) to activate the zoom in mode temporarily) the spectral region of interest and select graphically the signals that you want to analyze
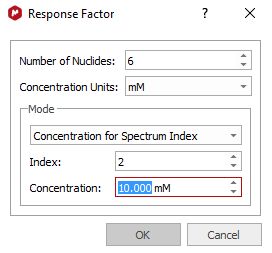
Once we have selected the first region (signal at around 2.10 ppm), a dialog box will be displayed to enter the 'response factor' values:
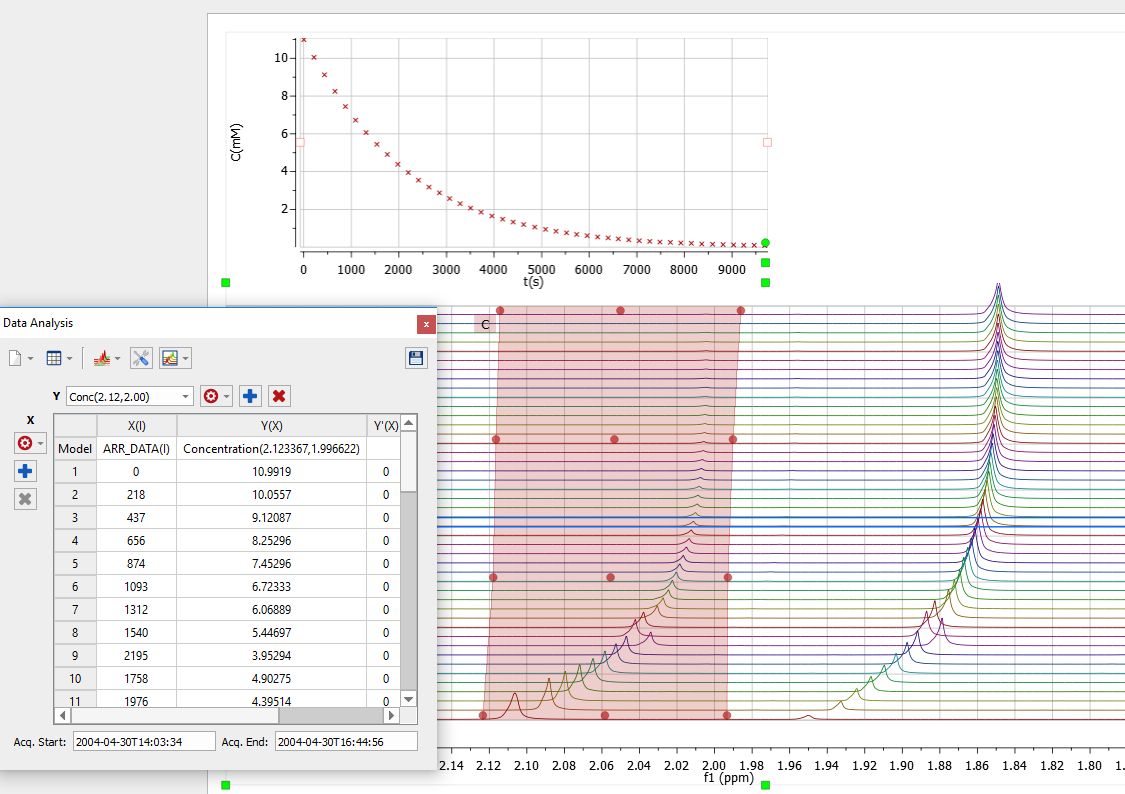
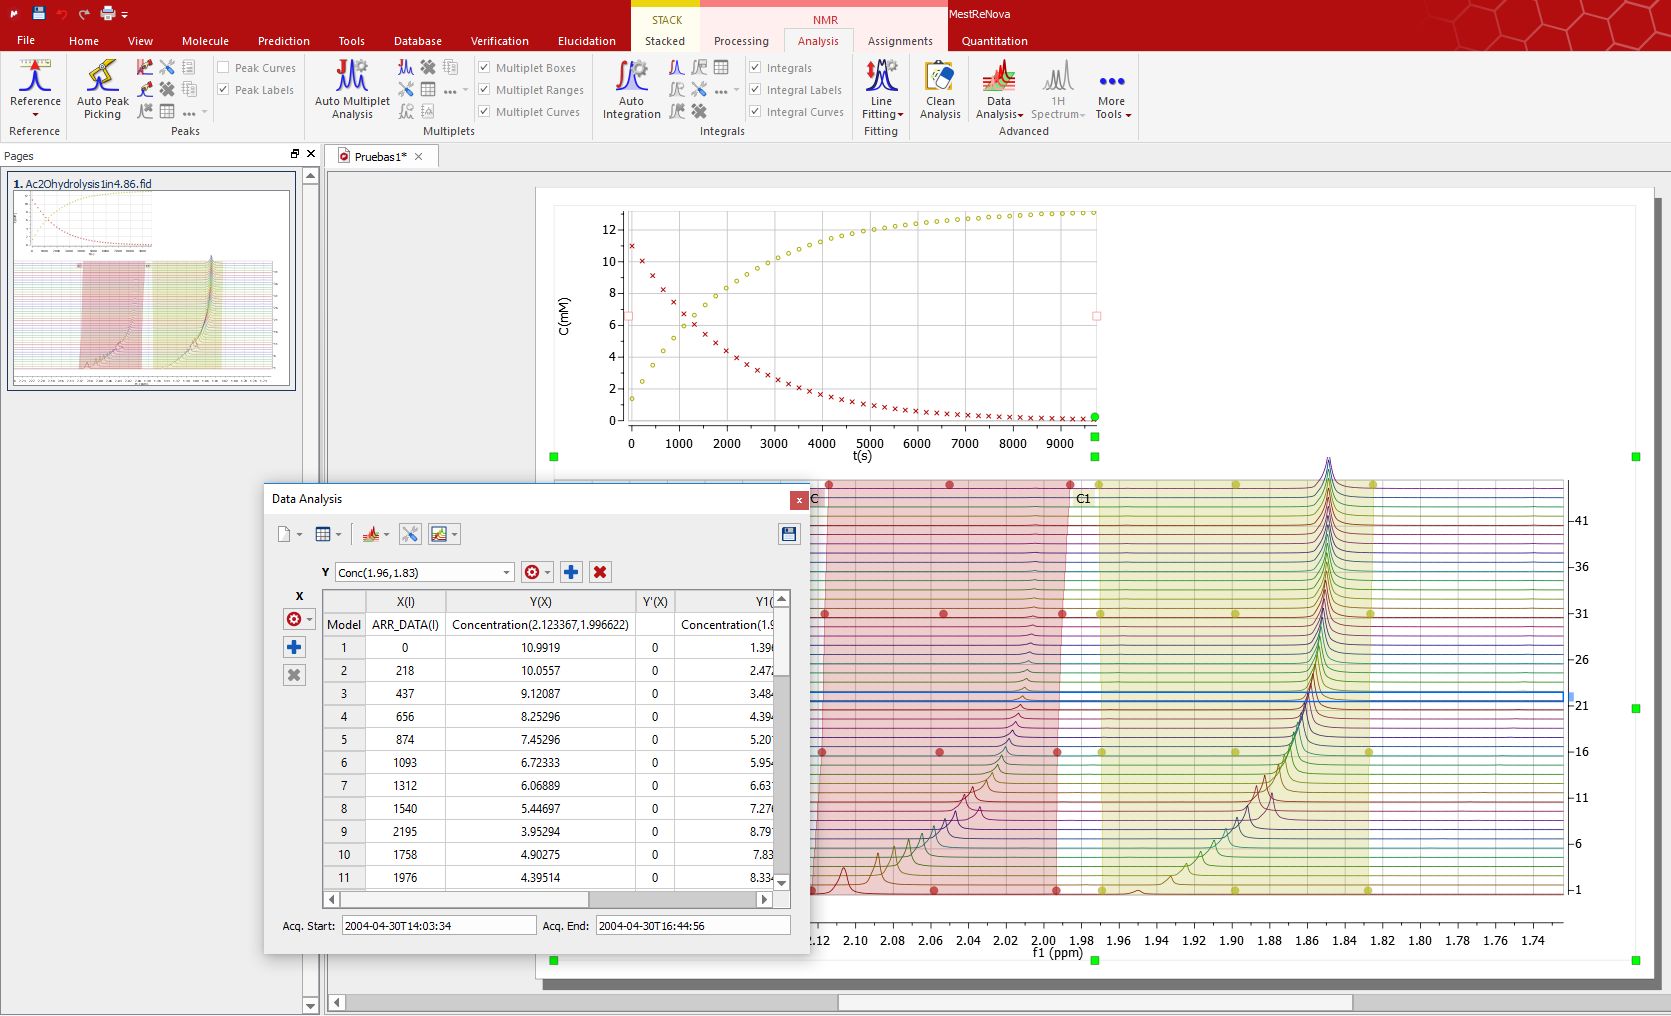
Clicking on OK, the graphic will appear on your spectral page and the 'Data Analysis' panel will be displayed:
The next step will be to select the second region of interest (around 1.90 ppm) and the number of nuclides (6):
We can use the green square handles to adjust the regions of interest with the deviation of the signals in the stacked (you could also use the 'Align Spectra' feature)
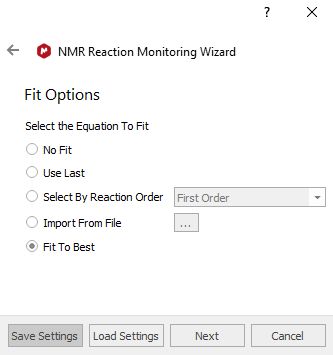
Clicking on the 'Next' button of the RM Wizard will allow us to select the equation for the fitting (or to ask to Mnova to search for the Best Fitting):
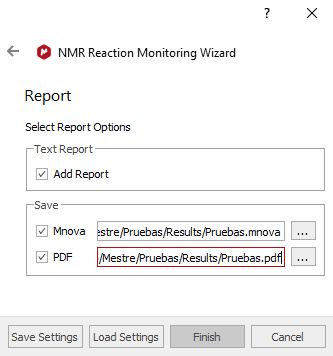
Clicking on the 'Next' button again, we will be allowed to paste the report into the Mnova document and to save the result in Mnova and PDF documents:
Clicking on the 'Finish' button, will do the job. You can 'save the settings' to be used in the future with similar datasets. |