Scripts Samples


Scripts Samples |
|
|
All the scripts are present in the examples/scripts installation directory. Some of them will be described in this chapter. Please bear in mind that you can run scripts from the command line, just by typing the path where the Mnova .exe file and the script are located and -sf "name of the script function": "mestrenovaPathname" "scriptPathname" -sf "scriptFunctionToRun"
For example:
"C:\Program Files\Mestrelab Research S.L\MestReNova\MestReNova.exe" "C:\Program Files\Mestrelab Research S.L\MestReNova\scripts\myScript.qs" -sf "myFunction" It is also possible to specify arguments:
"C:\Program Files\Mestrelab Research S.L\MestReNova\MestReNova.exe" "C:\Program Files\Mestrelab Research S.L\MestReNova\scripts\myScript.qs" -sf "myFunction",0.1,10,true,off
In this case, MNova will run myFunction(0.1,10,true,"off") from myScript.qs with the arguments specified. No spaces after commas!
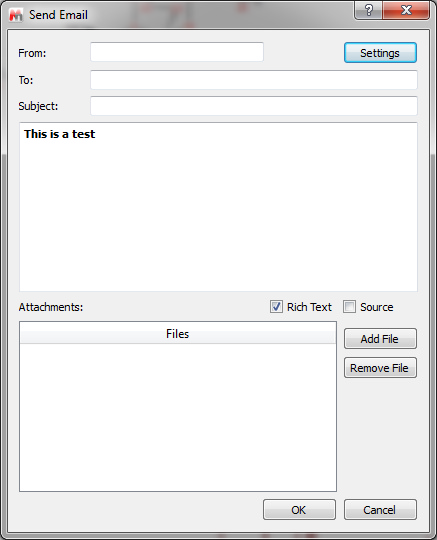
SendEmail: It is possible to send an email containing attachments (it needs Python installed in the same computer).
When the email is sent a message is shown:
testFilePermissions: this script will allow you to generate 'read-only' documents.
customImportProcessing: This script can be used to change the way of Mnova imports your NMR spectra. For example to stop the processing in the FID. Please follow the procedure below to set this script by default: 1: Go to ‘Edit/Preference/Scripts’ and add a new folder to sample scripts by clicking on the ‘blue plus button' 2: Save this script as a .qs file to the folder above. 3: Restart Mnova and load a 1H-NMR dataset. You will get your spectrum without any processing (just the FID).
Open and Save Document Script: Let´s take a look at an easy script which you can use to open a .mnova file and export it as a PDF file. In this case, we will open a .mnova file named 'Dimethoxy':
function openSaveDocument() { //If the open function gives a 'false', it will mean that Mnova does not recognize the file if( serialization.open("/dimethoxy.mnova") ) { print("File Opened"); //Let´s see what the document contains //To get the active document var dW = new DocumentWindow(Application.mainWindow.activeWindow()); //To get information about the number of the pages of the document print(dW.pageCount()); //To print the number of items and the description of them for each page for( var i = 0; i < dW.pageCount(); i++ ) { var pag = new Page(dW.page(i)); print ( "Page number "+i+" has "+pag.itemCount()+" items" ); for( var j = 0; j < pag.itemCount(); j++ ) { var item = new PageItem(pag.item(j)); print( "\t"+item.name ); //If the item is an NMR spectrum, it will print "This is an NMR spectrum", if not, the function isValid will give a "False" var spectrum = new NMRSpectrum(item); if(spectrum.isValid() ) print( "This is an NMR Spectrum" ); } } //To save as a PDF file serialization.save("/dimethoxy.pdf", "pdf"); } }
To run this script, just copy it to the 'Edit Script' dialog box and type "openSaveDocument()" in the combobox. Please bear in mind that, you will need to write the corresponding path of the saved Mnova file in the line 4 of the script (in this case the dimethoxy.mnova file was saved in C:\ ). As you can see in the script, if Mnova does not recognize the spectrum, you will obtain a 'False' message in the output due to the statement: if( serialization.open("/dimethoxy.mnova") )
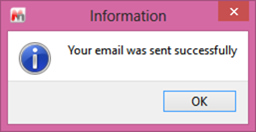
The line print("File Opened"); will give the corresponding message in the output, as you can see in the picture below:
The object 'Application' of the variable var dW = new DocumentWindow(Application.mainWindow.activeWindow()); gives us the 'Active Window' of the 'Main Window', that is to say, the document which we can see in the screen. The function print(dW.pageCount()); is used to know the number of the pages of the document.
The following lines of the script are used to obtain information about the items included on the document. For example the function pageCount is used to know the number of pages of the document. The variable var pag = new Page(dW.page(i)); will analyze page by page to find the information. The line print ( "Page number "+i+" has "+pag.itemCount()+" items" ); will print the corresponding phrase in the output, following the number of the page (+i+) and the number of the items included in the page for( var j = 0; j < pag.itemCount(); j++ ). The variable var item = new PageItem(pag.item(j)); will inform about the type of the item, and the function print( "\t"+item.name ); will print the name of the item. In this example (as we can see in the output of the picture below), the document has 2 pages; page 0 has 1 item, which is an NMR spectrum and page 1, has 5 items (NMR Spectrum, molecule, arrow, rectangle and ellipse).
The variable var spectrum = new NMRSpectrum(item); will rebuild the active spectrum, and if the item is an NMR spectrum, it will print "This is an NMR spectrum", if not, the function isValid will give a "False" due to the lines: if(spectrum.isValid() ) // print( "This is an NMR Spectrum" );.
Finally, the plugin serialization.save("/dimethoxy.pdf", "pdf"); will save the document as a PDF file in the specified location of the hard-disk (in this case, the PDF will be saved in C:\).
Open a spectrum with molecules: It is possible to open spectra with molecules by using the openSpecWithMols.qs example script. You will need to add the directory where you have the script to the ‘Scripts directories’ (by using the ‘'File/Preferences/Scripting/Scripts Directories’ menu). Then restart Mnova and you will be able to run the script from the command line by typing: “MestReNova path” –sf openSpecWithMols,”Spectrum path”
For example:
"C:\Program Files\Mestrelab Research S.L\MestReNova\MestReNova.exe" -sf openSpecWithMols,"C:\1H\fid"
Where, the yellow is the path where you have installed Mnova and the red is the path of the spectrum that you want to open.
// Opens a spectrum at aSpecPath and all the molfiles located in the same directory function openSpecWithMols(aSpecPath) { var dirPath = File.absDirPath(aSpecPath); var dir = Dir(dirPath); dir.cdUp(); var files = getMaskFiles(dirPath, dir.absPath, "*.mol", "*", false); files.push(dirPath); serialization.open(files); }
Import_Process_Save_Loop Script: This script can be used to apply a previously existing 'full processing' template (in this case, it is a template saved at C:/temp/proc.mnp) to several spectra (saved at C:/spectra/ and inside sub-folders with the extension ".fid", for example: "C:/spectra/1H.fid") and to save the result in different files formats (.mnova, .pdf and .txt). This script is only valid for these spectra containing a FID file.
/****************************************************************************************************** Copyright (C) 2007 Mestrelab Research S.L. All rights reserved.
This file is part of the MNova scripting toolkit.
Authorized users of MNova Software may use this file freely, but this file is provided AS IS with NO WARRANTY OF ANY KIND, INCLUDING THE WARRANTY OF DESIGN, MERCHANTABILITY AND FITNESS FOR A PARTICULAR PURPOSE. *****************************************************************************************************/ // This example function demonstrates how to apply some processing to a set of spectral files and to save the result in the different file formats. function import_process_save_loop() { const dirName = "c:/spectra"; // Source directory with spectra to be processed. const resultDirName = dirName; // Destination directory where processed spectra should be put. const procName = "c:/temp/proc.mnp"; // Processing file. It must be created in the Full Processing dialog of MestReNova. const fileMask = "fid"; // This mask specifies files to be processed. const dirMask = "*.fid"; // This mask specifies directories to be scanned for spectra.
var dir = new Dir(dirName); if (!dir.exists) { MessageBox.critical("Directory " + dirName + " does not exist.",MessageBox.Ok); return; } dir.cdUp();
// The below function getMaskFiles is located in the files.qs script. // If you run import_process_save_loop from QSA Workbench then it is necessary to introduce getMaskFiles to the interpreter by importing files.qs. var files = getMaskFiles(dirName, dir.absPath, fileMask, dirMask, true); for(var i = 0; i < files.length; i++) { var dw = new DocumentWindow(Application.mainWindow.newWindow()); // Create new document window if (serialization.open(files[i])) { nmr.process(procName); const toReplace = new RegExp("[/|:]", "g"); fileName = resultDirName + "/" + files[i].replace(toReplace, "_"); // Generate a filename for processed spectrum. serialization.save(fileName+".mnova", "mnova"); // MestReNova file format serialization.save(fileName+".pdf", "pdf"); // Adobe PDF file format serialization.save(fileName+".txt", "ascii"); // ASCII print(fileName); // Prints file name in the debug window } dw.close(); // Close document window of processed spectrum } }
Parameters Script: This script can be used to obtain the desired parameters on your spectrum. You will be able to add or remove any parameter and to change the font by just using HTML code.
function spectrumParams() { var spec = new NMRSpectrum( nmr.activeSpectrum() ); var htmlText = "<b>Nucleus</b>: %1 <br/> <b>Frequency: </b> %2 <br/> <b>Pulse Sequence: </b> %3 <br/> <b>psLabel: </b> %4 <br/> <b>Solvent: </b> %5 <br/> <b>Title: </b> %6"; var nuc = spec.getParam("Nucleus[1]"); var freq = spec.getParam("Spectrometer Frequency"); var seqfill = spec.getParam("Pulse Sequence"); var psLabel = spec.getParam("psLabel"); var Solvent = spec.getParam("Solvent"); var Title = spec.getParam("Title"); print(spec.getParam("Nucleus[1]")); print(spec.getParam("Spectrometer Frequency")); print(spec.getParam("Pulse Sequence")); print(spec.getParam("psLabel")); print(spec.getParam("Solvent")); print(spec.getParam("Title")); htmlText=htmlText.arg(nuc).arg(freq).arg(seqfill).arg(psLabel).arg(Solvent).arg(Title); draw.text(htmlText, true); }
In this case, the script will print the parameters Nucleus, Spectrum Frequency, Pulse Sequence, psLabel, Solvent and Title. Please bear in mind that getParam function returns only parameters which exist in the table of parameters (including invisible ones). Please make sure that you have these parameters included on the table of parameters (via customization dialog).
Fid Test Script: you will get information about the real and the imaginary part of the FID by running this script:
function fidTest() { var spec = new NMRSpectrum( nmr.activeSpectrum() ); print(spec.fidImag(0)); if( spec.fidSetImag(0,0) ) print(spec.fidImag(0)); print(spec.fidReal(0)); if(spec.fidSetReal( 0, 0 ) ) print(spec.fidReal(0)); spec.process(); mainWindow.activeWindow().update(); }
The command print(spec.fidImag(0)) will return the value of the imaginary part of the FID at the aIndex point (in this case; 0. You can type any number from zero to the number of points of your spectrum), whilst the line print(spec.fidReal(0)); will give you the value of the real component. The object fidsetImag; sets the imaginary value of the aIndex point of the spectrum fid.
Integral Test Script: This script can be used to get information about the integrals of the spectrum:
function integralTest() { var spec = new NMRSpectrum( nmr.activeSpectrum() ); var intList = new Integrals(spec.integrals()); print(intList); print(intList.count); print(intList.normValue);
var myInt = new Integral(intList.at(0)); print(myInt); print(myInt.rangeMax(1)); print(myInt.rangeMin(1)); if( spec.dimCount > 1 ) { print(myInt.rangeMax(2)); print(myInt.rangeMin(2)); }
print("Integral Value "+myInt.integralValue()); print("Normalized value "+myInt.integralValue(intList.normValue));
var sReg = new SpectrumRegion(7.2, 7.5); var newInt = new Integral( spec, sReg, false ); print(newInt); print(newInt.integralValue()); spec.integrals().append(newInt); spec.process(); }
The first part of the script is used to count the integrals and to report the normalized value applied to the integrals (in the list 'intList'). With the second part of the script, the user is able to select any integral of the list (in this case the integral which appears in the first position, if we wanted to select the second integral, we should have to type var myInt = new Integral(intList.at(1));). Then the scripts returns the absolute value and the limits of the selected integral. The third part of the script returns the absolute and the normalized value of the integral.
The last part of the script can be used to add a new integral to the list (in this case an integral with the spectral region from 7.2 to 7.5 ppm). the script reports the absolute value of this integral.
Multiplet Test Script: This script is valid to obtain information about the multiplets of the spectrum and also to apply a 'manual multiplet analysis':
function multipletTest() { var spec = new NMRSpectrum( nmr.activeSpectrum() ); print(spec.multiplets()); var sMult = new Multiplets(spec.multiplets()); print(sMult.count); print(sMult.at(2));
var sReg = new SpectrumRegion(7.0, 7.5); var mult = new Multiplet( spec, sReg ); var myMultiplets = new Multiplets(); myMultiplets.append( mult );
var mult2 = new Multiplet( spec, new SpectrumRegion(3.80,3.90) ); myMultiplets.append( mult2 );
var nM = new Multiplet(new SpectrumRegion(3.65,3.75), "t"); nM.name="My mulltiplet"; myMultiplets.append(nM);
print(myMultiplets); spec.setMultiplets(myMultiplets); print(spec.multiplets()); spec.process(); }
The first part of the script creates a list of the multiplets which appear on the spectrum and prints some information about the selected multiplet (in this case, the multiplet number 2, but of course you can select any other multiplet). The second part of the script creates a multiplet in the selected region 'sReg' (in this case the region is 7.0-7.5 ppm. It works as a manual multiplet analysis). Then, it creates a new empty list of multiplets which is added.
The third part of the script consists in a new region (from 3.80 to 3.90 ppm) to apply the multiplet analysis. The following part of the script is used to add a multiplet manually to the multiplet list (the user will be able to remove this part of this script without any problem). In this case, we wanted to add a triplet, which appears in the region from 3.65 and 3.75 ppm, with the name 'My multiplet'.
The end of the script is used to replace the original multiplet list for the list which we have just created.
Peak Test Script: A similar script used to obtain information about the chemical shift and the intensity of the peaks of a 1D-NMR spectrum:
function peakTest() { var spec = new NMRSpectrum( nmr.activeSpectrum() ); var sR = new SpectrumRegion( 0, 9.5 ); var ps = new Peaks(spec, sR); //fill the list with the peaks in sR print(ps); var p = new Peak(1.265, spec); print(p); ps.append(p); spec.setPeaks(ps);//Set the peaks to ps print( spec.peaks()); spec.process(); }
After running this script, we will get the peak picking analysis of a 1D-NMR spectrum from 0 to 9.5 ppm (of course, we will be able to change this range). Then, a new peak at 1.265 ppm will be added to the peak list (again, you can add any other peak, if you want), reporting the intensity value of this new peak. Finally, the spectrum will be re-analyzed to obtain the new number of peaks.
A similar script can be used for a 2D-NMR spectrum, but in this case we have to type the corresponding spectrum region in 2D mode:
function peakTest() { var spec = new NMRSpectrum( nmr.activeSpectrum() ); var sR = new SpectrumRegion(4.0, 3.5, 75, 65 ); var ps = new Peaks(spec, sR); //fill the list with the peaks in sR print(ps); var p = new Peak(72.73, 3.17, spec); print(p); ps.append(p); spec.setPeaks(ps);//Set the peaks to ps print( spec.peaks()); spec.process(); }
Multiplet Reporter script: Let´s take a look now at a very important part of the 'Multiplet Reporter_JACS' script:
// This function defines JACS-like multiplet report. // To customize report, edit this class or implement another one. function JACSMultipletReporter()
}
JACSMultipletReporter.prototype = new MultipletReporter(); JACSMultipletReporter.prototype.toString = function() { return "JACSMultipletReporter()"; }
(...)
The user will be able to change the multiplet report template to obtain the desired multiplet report; for example:
this.onlyElementName=false; changing false with true, we will obtain only the element name without the atomic mass (For example: H, C instead of 1H, 13C).
The function: this.font = "<font style=\"font-size: 10pt; font-family: Times New Roman\">"; will define the font size and the font family of the multiplet report.
The line: this.header = "%1 NMR (%2 MHz, %3) δ "; is used to print the header of the report, where %1 will be the nucleus (H or C), %2 the frequency of the spectrometer (in MHz), and %3 the solvent, followed by a delta symbol (δ). For example: "1H NMR (500 MHz, CDCl3) δ".
The sentence: this.reportRange = true is used to obtain the multiplet range instead of the chemical shift.
The functions: this.withoutJsTemplate = " %1 (%2, %3H)" and this.withJsTemplate = " %1 (%2, %4, %3H)" are used to customize the appearance of the multiplet report by changing the positions of %1, %2, %3H, or %4 (where, %1 means: chemical shift; %2 means: type of multiplet (s, d, t, etc); %3H means: number of hydrogens and %4 means the coupling constant value). As you can see, the first line shows a multiplet without coupling constants, (while the last line shows a multiplet with coupling constants).
So, if you need to obtain something like this (Japanese format):
1H NMR (300 MHz, Solvent) δ ppm 6.43-6.22 (1 H, m), 3.17 (1 H, q, J = 7.15 Hz) etc…
You should modify both lines, as you can see below:
this.withoutJsTemplate = %1 (%3H, %2)"; this.withJsTemplate = " %1 (%3H, %2, %4)";
If you prefer to obtain something like this: 1H NMR (300 MHz, Solvent) δ ppm 1.23 (d, J = 1.2 Hz, 3 H), etc… Just replace the original lines with: this.withoutJsTemplate = %1 (%2, %3H)"; this.withJsTemplate = " %1 (%2, %4, %3H)";
To obtain the coupling constant symbol in normal instead of ‘italic’, just modify the script by removing the italic format (<i>J</i>). If you prefer to obtain it in "bold" just type: this.jListTemplate = "<b>J</b> = %1";
The following paragraph will be used to customize the appearance of the coupling constants list:
this.jPrecision = 1; // J's precision this.deltaPrecision = 2; // delta precision this.mSeparator = ", "; // multiplet separator this.jSeparator = ", "; // J's separator
The first line is used for the precision of the coupling constants values, the second will be used for the precision of the chemical shift and the remaining two lines will print the separation between the multiplets and the coupling constants values.
If you need to obtain the coupling constants in descending order, replace 'true' with 'false' in the following line: var jList = new JList(multiplet.jList()); jList.sort(true); If you want to obtain the multiplet chemical shifts in ascending order, just replace the 'false' with 'true' in the script: var multiplets = new Multiplets(spectrum.multiplets()); // get multiplets from spectrum jList.sort(true); To obtain the multiplet range in ascending order, just replace the rangeMin with rangeMax (and vice versa) in the line below of the script: shiftStr = this.rangeTemplate.argDec(multiplet.rangeMax, 0, 'f', this.deltaPrecision).argDec(multiplet.rangeMin, 0, 'f', this.deltaPrecision);
Title and Solvent: running this script, you will get the title and the solvent on your spectrum
// <GUI menuname="title1" shortcut="Ctrl+2" tooltip="Title_and_Solvent" /> function title1() { //To get the active spectrum var spectrum = nmr.activeSpectrum(); //The function isValid informs about if the spectrum obtained is correct print( spectrum.isValid() ); var tit = draw.text("<h3>"+ spectrum.title+" "+spectrum.solvent+"</h3>", true);
}
Zoom: This script can be used to apply a zoom into a selected range of a spectrum. In order to select the horizontal range, just type the desired values between the brackets on the line spc.horZoom(1.0, 5.0);
If you want to set the vertical zoom, just change the values of the line spc.vertZoom(-100, 7000)
function spectrumZoom() { var spc = nmr.activeSpectrum(); if( !spc.isValid() ) return; spc.horZoom(1.0, 5.0); spc.vertZoom(-100, 7000); spc.update(); mainWindow.activeWindow().update(); }
Properties Script: You will find below a script example to change some properties of your spectra. In this case, the colour of the spectrum will be changed to red, the peaks font to Arial and the integral curves will be showed. You will find all the available properties at the 'Mnova Properties' chapter:
function properties() { var spec = new NMRSpectrum(nmr.activeSpectrum());
spec.setProperty("curve.color","red"); spec.setProperty("peaks.font","Arial"); spec.setProperty("integrals.curve.show", true); spec.update(); mainWindow.activeWindow().update();
}
Cutting: This script can be used to apply cuts to the spectra. You will obtain two cuts in your spectrum, between 1.0-3.5 and 7.0-8.0 ppm respectively.
}
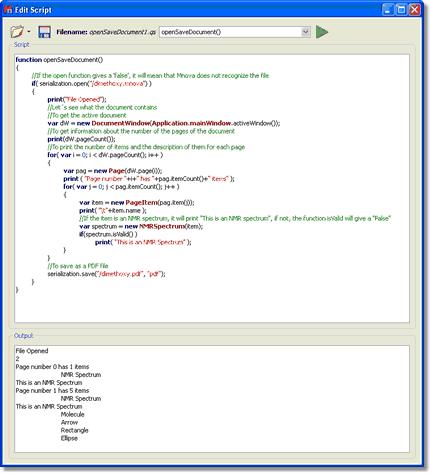
Processing script: Here you can see a part of the 'mnrProcessingTest" script stores under the examples folder:
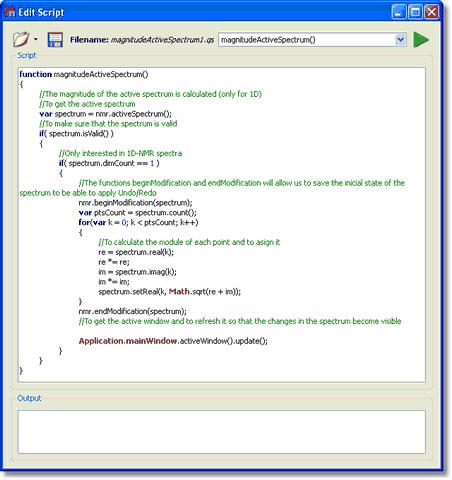
Magnitude Active Spectrum script: Let´s see another script; in this case this script is used to obtain the 1D-NMR spectra in magnitude. Just open a 1D-NMR spectrum in Mnova, load this script by following the menu 'Script/Edit Script', type "magnitudeActiveSpectrum()" in the edit box and click on the green triangle to run the Script. You will obtain automatically your 1D-NMR spectrum in magnitude.
Please bear in mind that it is also possible to run scripts from the command line, just by typing the path where the Mnova .exe file and the script are located and -sf "name of the script function": "mestrenovaPathname" "scriptPathname" -sf "scriptFunctionToRun"
For example:
"C:\Program Files\Mestrelab Research S.L\MestReNova\MestReNova.exe" "C:\Program Files\Mestrelab Research S.L\MestReNova\scripts\magnitudeActiveSpectrum.qs" -sf "magnitudeActiveSpectrum"
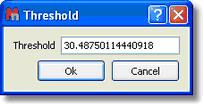
Threshold Script: This script will allow the user to adjust the threshold of the color scheme in 2D-NMR spectra:
// <GUI menuname="threshold2D" shortcut="Ctrl+T" tooltip="threshold2D" /> function threshold2D() { var spectrum = nmr.activeSpectrum(); if(!spectrum.isValid() ) return
var th = spectrum.threshold;
var dlg = new Dialog(); dlg.title = "Threshold";
var edit = new LineEdit(); edit.label = "Threshold"; edit.text = th; dlg.add(edit); if (dlg.exec()) { spectrum.threshold = edit.text; } spectrum.update();
mainWindow.activeWindow().update(); }
Running this script will show the 'Threshold' dialog box. From this window, the user will be able to adjust the threshold of the colour scheme by just typing the desired value and clicking on the 'OK' button.
ProcessTest Script: This script can be used to get some data from Mnova, save it as a file, next run some external program in order to make calculations (or whatever you need) and once the external program finishes, Mnova will get the result from another file. In this case the external program is the 'NotePad'.
function processTest() { fileName = Dir.temp() + "MNova_Process_Text.txt"; var f = new File(fileName); f.open(File.WriteOnly); var s = TextStream(f); s.write("Hello Notepad!"); f.close(); print(Process.execute("notepad.exe", fileName));
f.open(File.ReadWrite); s.pos = f.size; print(s); s.write("\r\nHi again!"); f.close(); print(Process.startDetached("notepad.exe", fileName)); }
|