Mnova for metabonomics


Mnova for metabonomics |
|
|
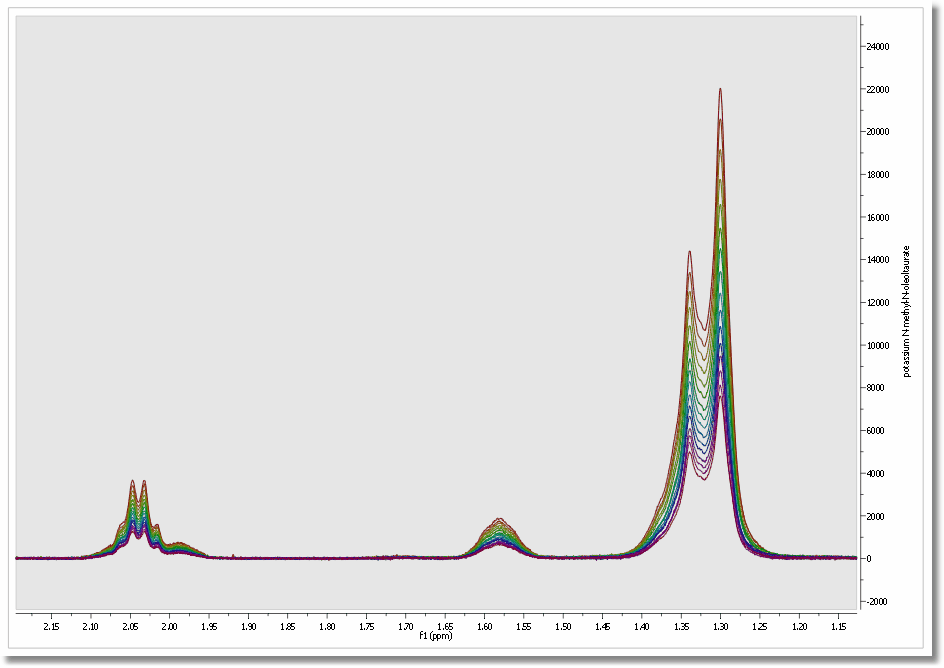
Mnova allows you to easily process large datasets with the best quality in order to obtain the most precise results. Once datasets have grown to 20-200 spectra, manual processing is no longer an option. Mnova can automate the processing of large datasets of biofluids to extract an ASCII file ready for the statistical measurement. Mnova includes powerful specific Phase and Baseline Correction algorithms for 1D and 2D biofluid spectra in order to get the correct quantification
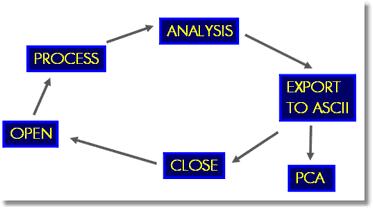
Getting Started Mnova can be used on large datasets of biofluid spectra in two main ways, depending on the size of the dataset. Graphical (<100 spectra): this mode allows all processing commands to be executed on a group of spectra simultaneously making possible the interaction with all spectra at the same time. Scripting (>100 spectra): the user will only need to open a single spectrum of the dataset and optimize the processing in order to apply it to the remaining spectra by using the scripting capability implemented in Mnova.
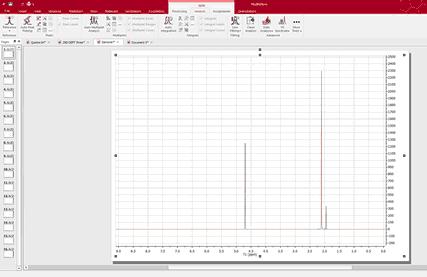
Processing Basics Let´s take a look at the ‘graphical method’. 1. When the dataset is small, we can drag the spectra folders to Mnova in order to get all the spectra fully processed (you can also use the multiOpen script). In this case I have dragged 16 spectra folders to the Mnova icon. After about 5 seconds, I got all the spectra fully processed as you can see in the picture below
2. Select all the spectra in the page navigator in order to create the stacked spectra. We can do it by pressing ‘Ctrl/Cmd+A’ or by following the ‘Stack/Stack Spectra’ menu.
3. Select one of them (by selecting ‘Active Spectrum’ in the Stack scroll down menu of the left-vertical button) and apply the necessary processing and analysis (phase and baseline corrections, binning, signal suppression…). The operations to the first spectrum will be applied simultaneously over the whole dataset.
Mnova incorporates several specific features for biofluid samples; such as Automatic Phase and Baseline corrections algorithms, Solvent Suppression (to remove, for example, the dispersive signal of the water), Auto-tuning referencing, Binning (or bucketing), Normalize, Global Spectral Deconvolution (work in progress).
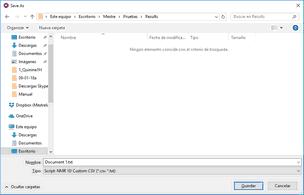
4. Once the processing and analysis have been made, we can export to an ASCII file for the PCA or PLS, just by following the menu ‘File/Save As/NMR CSV File (*.csv *.txt)’; making sure that you type the extension *.txt in the filename field:
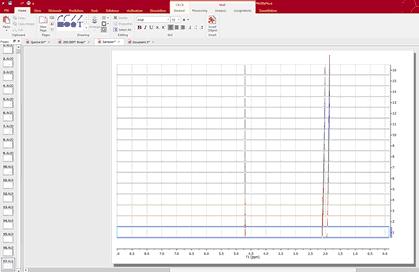
Highlight the stacked spectra and follow the menu ‘Stack/Superimpose Spectra’ to overlay them (useful for example to check that all spectra are perfectly aligned of referenced):
Scripting Method
Mnova includes Scripting capabilities to automate the previous process with the ability to create Processing Templates which can be used with our Script engine to perform batch processing. Mnova includes a powerful and flexible feature which allows the user to easily automate the full processing of both 1D & 2D NMR data sets. This is ideal for the batch processing of spectra of the same type, and can also incorporate analysis operations.
For example, let's say you have acquired 20 proton spectra which you want to process using the same processing operations. The procedure is very simple:
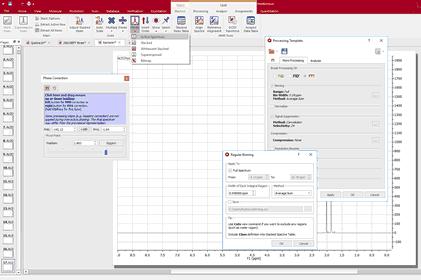
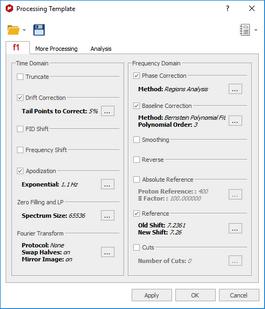
1. Load one spectrum and process it as desired. 2. Go to Processing/Processing Template. The following dialog appears:
This dialog includes all the processing and analysis features implemented in Mnova. You can choose the required options by selecting the check boxes and, if necessary, specify options by clicking the button next to the corresponding command.
3. Once you are happy with the result, save the script file to a Mnova Processing file (*.mnp) by clicking on the save button in the dialog box. Once you have saved this template, you will be able to run a script to process all the spectra in the same way. If the number of datasets is too large, Mnova is able to open, process (apodization, FT, Zero Filling, LP, phase and baseline Correction…), analyze (binning, etc.), save to an ASCII file and close the spectrum, in order to open the next one and continue with the processing (to avoid an excessive use of memory). If the number is not large, Mnova can keep all the spectra fully processed on screen.
You can use the below script to automate the above process and save all the result into the same ASCII file. You will be able to download it here
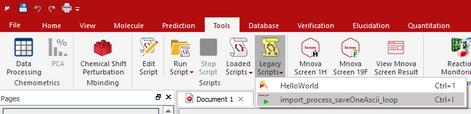
Copy this script to the scripts folder of Mnova (that you have selected by following the menu ''File/Preferences/Scripts/Directories'), restart the software and the script will appear under the ‘Scripts’ menu.
Please bear in mind that you can introduce this script into the toolbar by using the ‘Toolbar Customization’ feature (View/Customize User Interface/Customize Toolbars’).
To read more about Mnova scripting, please click here
//<GUI menuname="import_process_saveOneAscii_loop"shortcut="Ctrl+I"tooltip="Auto Process and Save as ASCII"/> /****************************************************************************** Copyright (C) 2008 Mestrelab Research S.L. All rights reserved. This file is part of the MNova scripting toolkit. Authorized users of MNova Software may use this file freely, but this file is provided AS IS with NO WARRANTY OF ANY KIND, INCLUDING THE WARRANTY OF DESIGN, MERCHANTABILITY AND FITNESS FOR A PARTICULAR PURPOSE. ******************************************************************************/ // This example function demonstrates how to apply some processing to a set of spectral files and to save the result in a single ASCII file. function import_process_saveOneAscii_loop() { const procName = "c:/procTemplates/proc.mnp"; // Processing file. It must be created in the Processing Template dialog of MestReNova. const fileMask = "fid"; // This mask specifies files to be processed. const dirMask = "*"; // This mask specifies directories to be scanned for spectra.
// Select a directory with spectral data const specDirKey = "import_process_saveOneAscii_loop/SpectraDir"; var dirName = FileDialog.getExistingDirectory(settings.value(specDirKey, Dir.home()), "Select Spectra Directory"); if (!dirName) return; var dir = new Dir(dirName); dir.cdUp();
// Select a file to save the output const outDirKey = "import_process_saveOneAscii_loop/OutputDir"; var saveDir = settings.value(outDirKey, Dir.home()); // Get last used directory name var fileName = FileDialog.getSaveFileName("ASCII Files (*.txt)", "Select Output File", saveDir); if (!fileName) return;
// Open the selected file and create a text stream mapped to it var fout = new File(fileName); settings.setValue(outDirKey, fout.absDirPath); // Save the directory name to be used another time the script is called var sout = new TextStream(fout); sout.precision = 10;
// Temporary file name const lastOutName = Dir.temp() + "/import_process_saveOneAscii_loop.lastOut.tmp"; if (File.exists(lastOutName)) File.remove(lastOutName);
// The below function getMaskFiles is located in the files.qs script. var files = getMaskFiles(dirName, dir.absPath, fileMask, dirMask, true); for(var fi = 0, length = files.length; fi < length; fi++) { var dw = new DocumentWindow(Application.mainWindow.newWindow()); // Create new document window if (serialization.open(files[fi])) { nmr.process(procName); // Apply processing template var spec = new NMRSpectrum(nmr.activeSpectrum());
fout.open(File.WriteOnly);
var flastOut = new File(lastOutName); var slastOut = new TextStream(flastOut); if (!fi) { // Put fist column of the file in ppm. The scale is taken from the first spectrum. flastOut.open(File.WriteOnly); slastOut.precision = 10;
var ppm = spec.hz()/spec.frequency(); var dPpm = spec.scaleWidth()/spec.count()/spec.frequency(); for(var si = spec.count()-1; si >= 0; si--) { slastOut.write(ppm, "\n"); ppm += dPpm; } flastOut.close(); } flastOut.open(File.ReadOnly);
for(var si = spec.count()-1; si >= 0; si--) sout.write(slastOut.readLine(), "\t\t", spec.real(si), "\n");
fout.close(); flastOut.close(); flastOut.remove(); if (fi < length-1) File.copy(fileName, lastOutName); } dw.close(); // Close document window of processed spectrum } }
|