Show Traces in 2D-NMR


Show Traces in 2D-NMR |
|
|
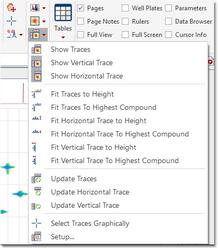
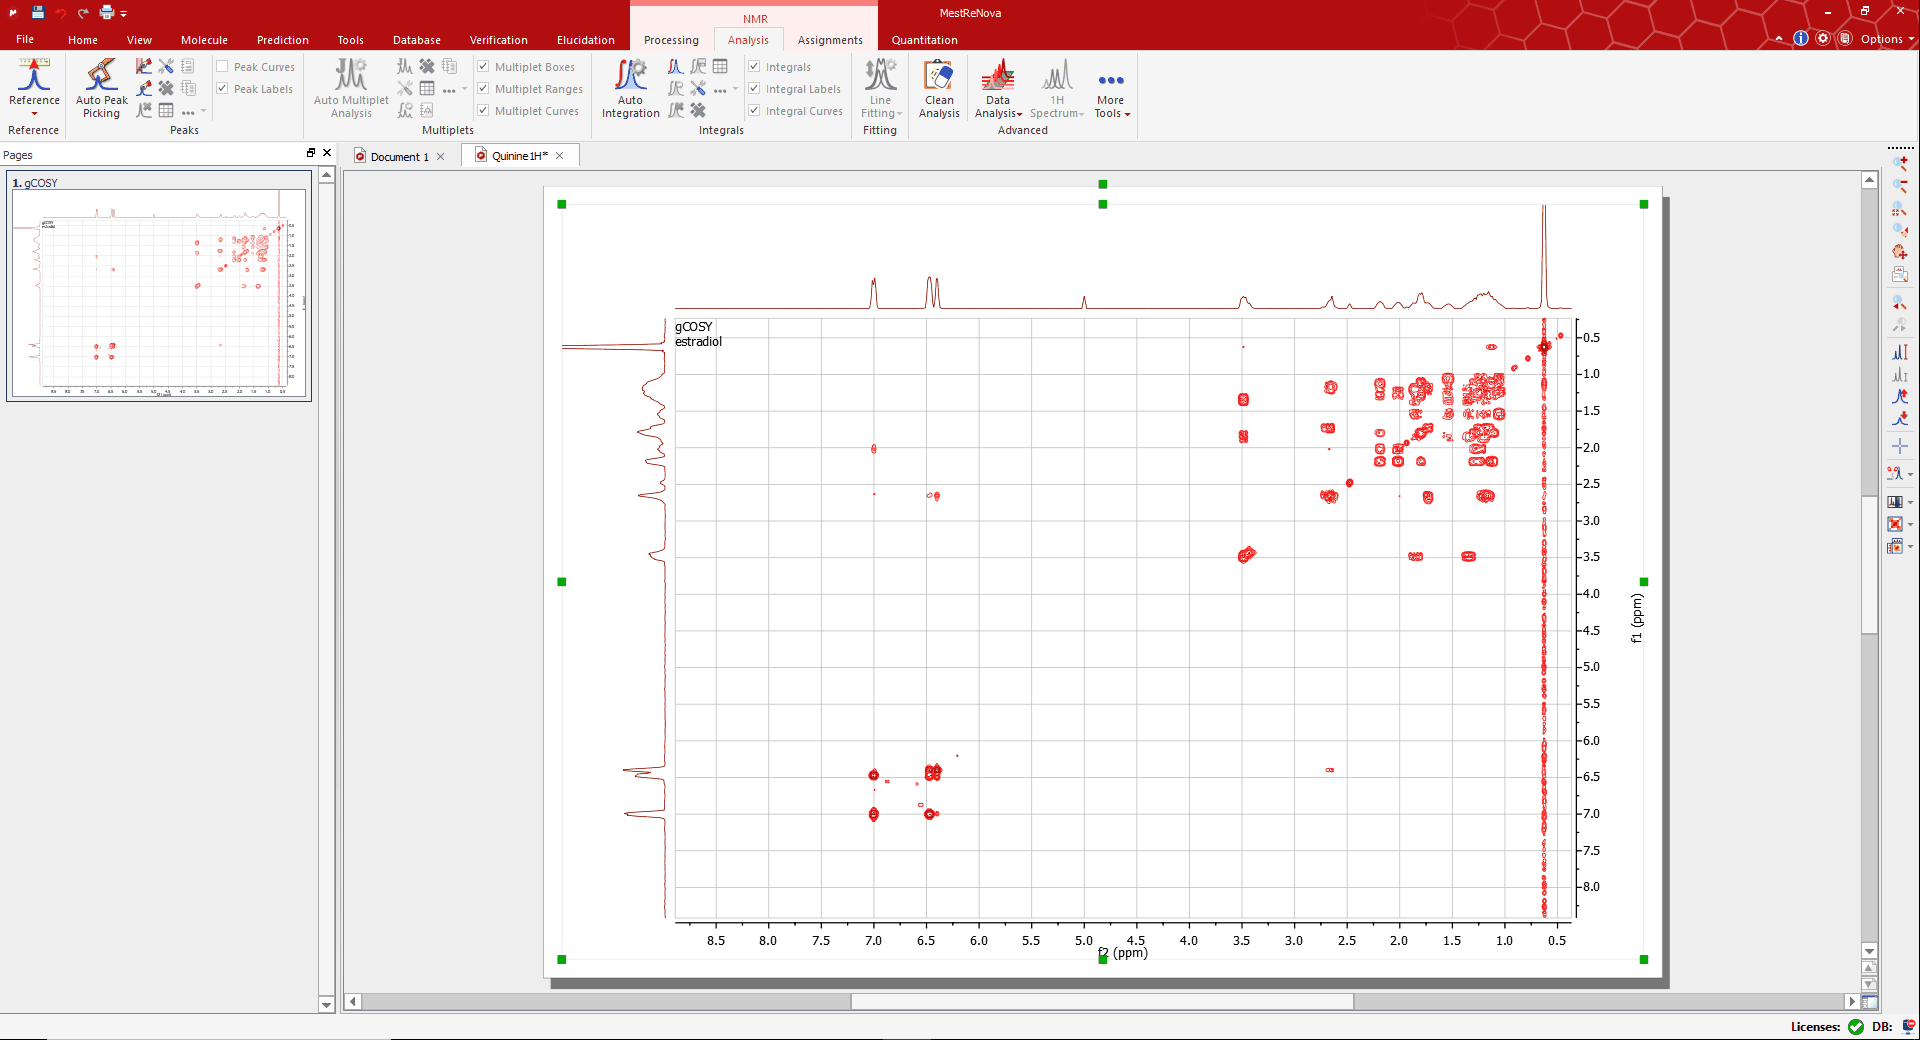
The user can show the traces of the 2D-NMR spectrum, just by clicking on the 'Show Traces' icon
To move the trace, just hover the mouse over the top-right areas of the slices (the arrow cursor will change to a vertical panning cursor) and then click & drag your mouse in the desired direction. You will obtain the same result by holding the 'Ctrl' (Cmd in Mac) key while scrolling the mouse wheel over the trace.
Mnova automatically detects the 1D spectra and use them as external traces of a 2D plot if the applicable option is checked under the 'File/Preferences/NMR/Import' menu.(All the spectra must be opened in the same document). Any phase, baseline correction or reference applied to the 1D spectra will automatically update the applicable trace in the 2D plot.
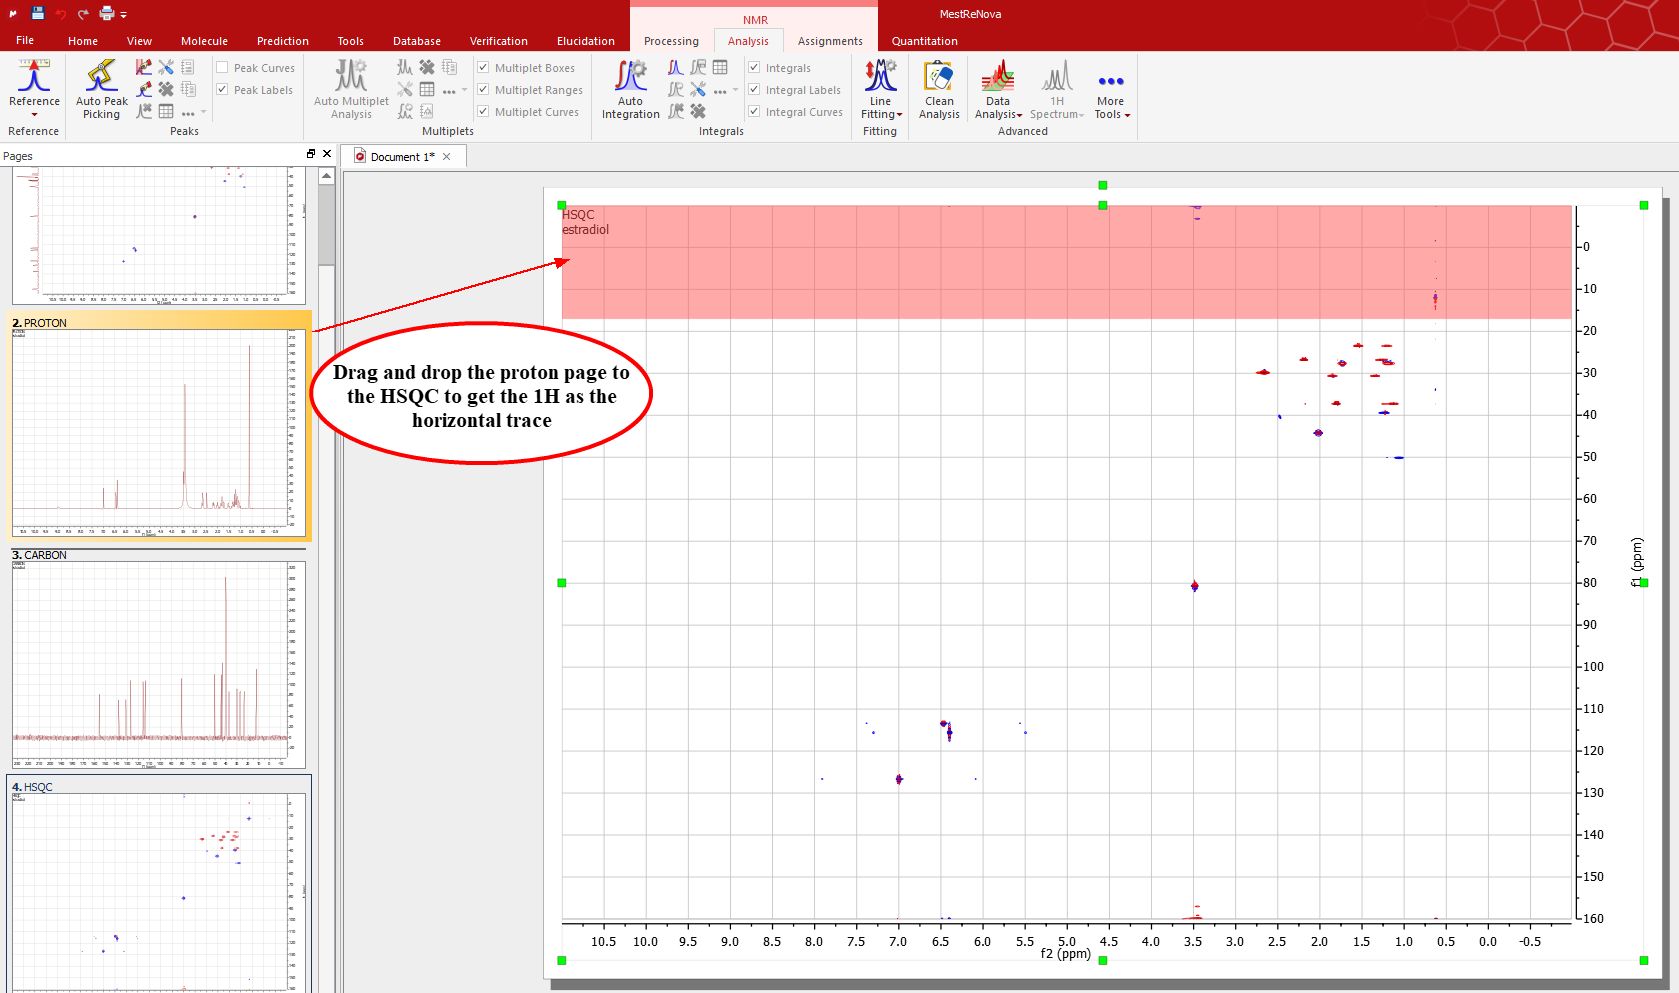
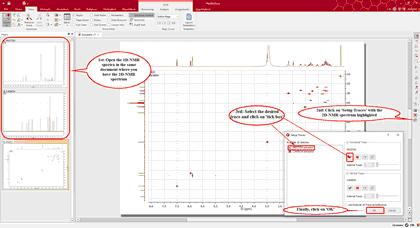
If the 'Auto Attach Traces' option is not checked, you can drag and drop any currently opened 1D-NMR spectrum to a 2D NMR dataset in order to get them as traces. Here you can see how the page number 2, containing a 1H dataset is dropped to the HSQC to get the horizontal trace:
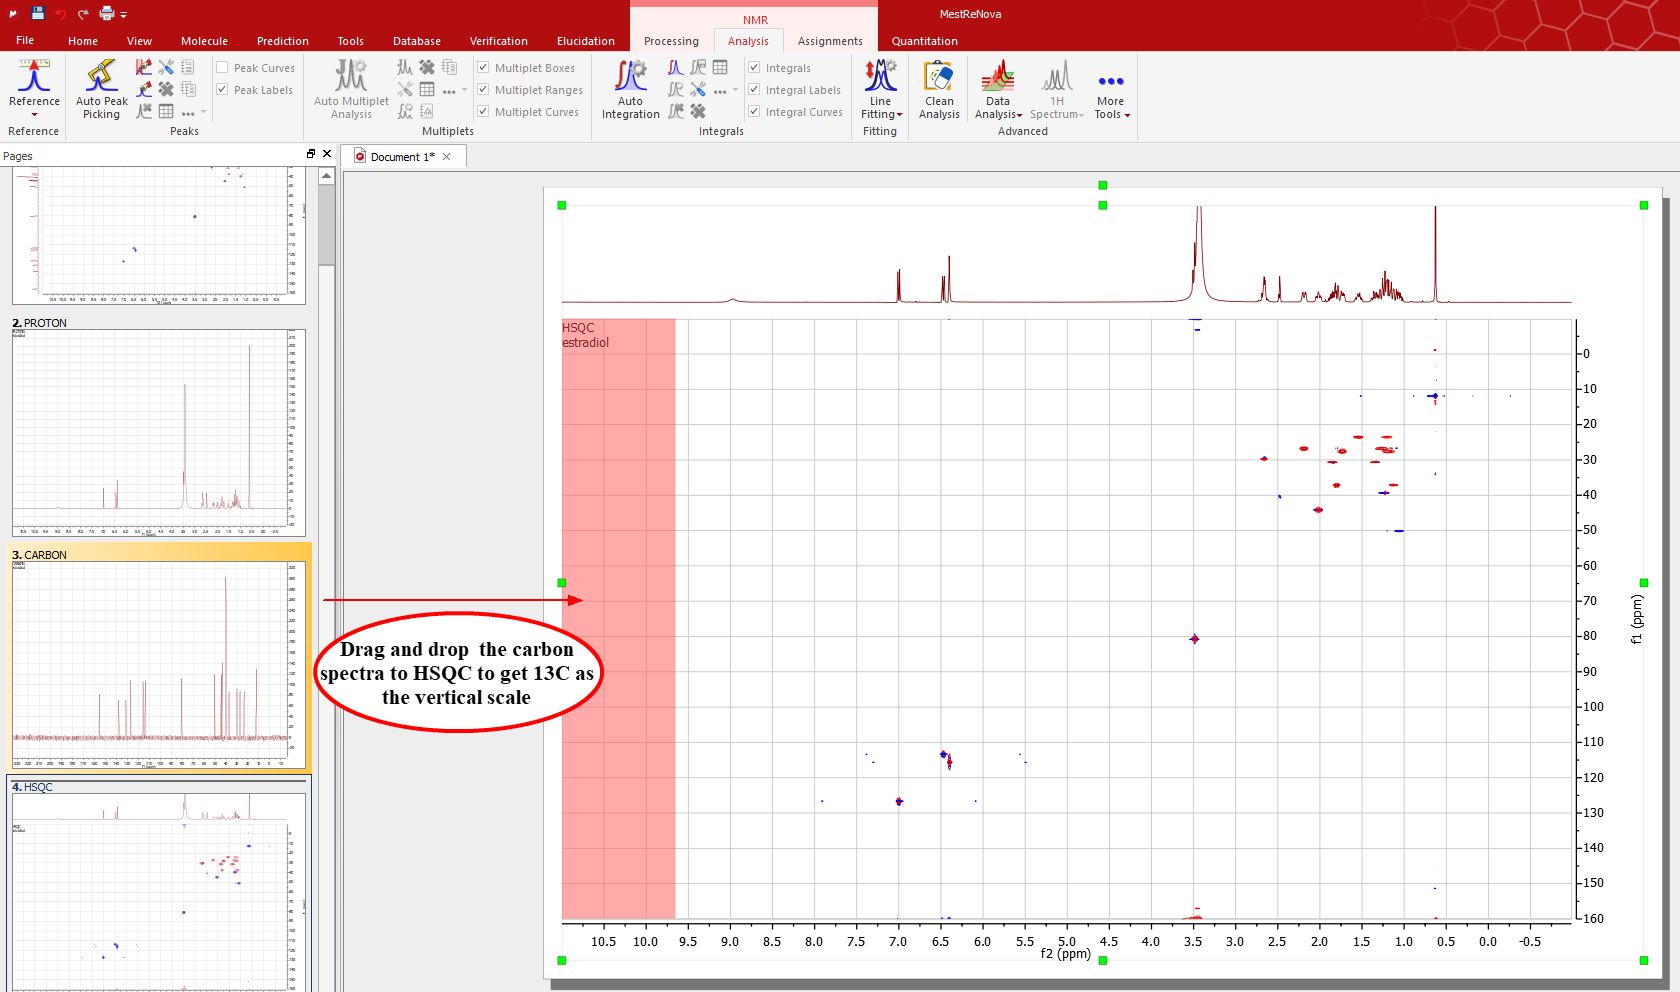
The same can be done with the page 3 (containing a 13C spectrum) to get the vertical trace:
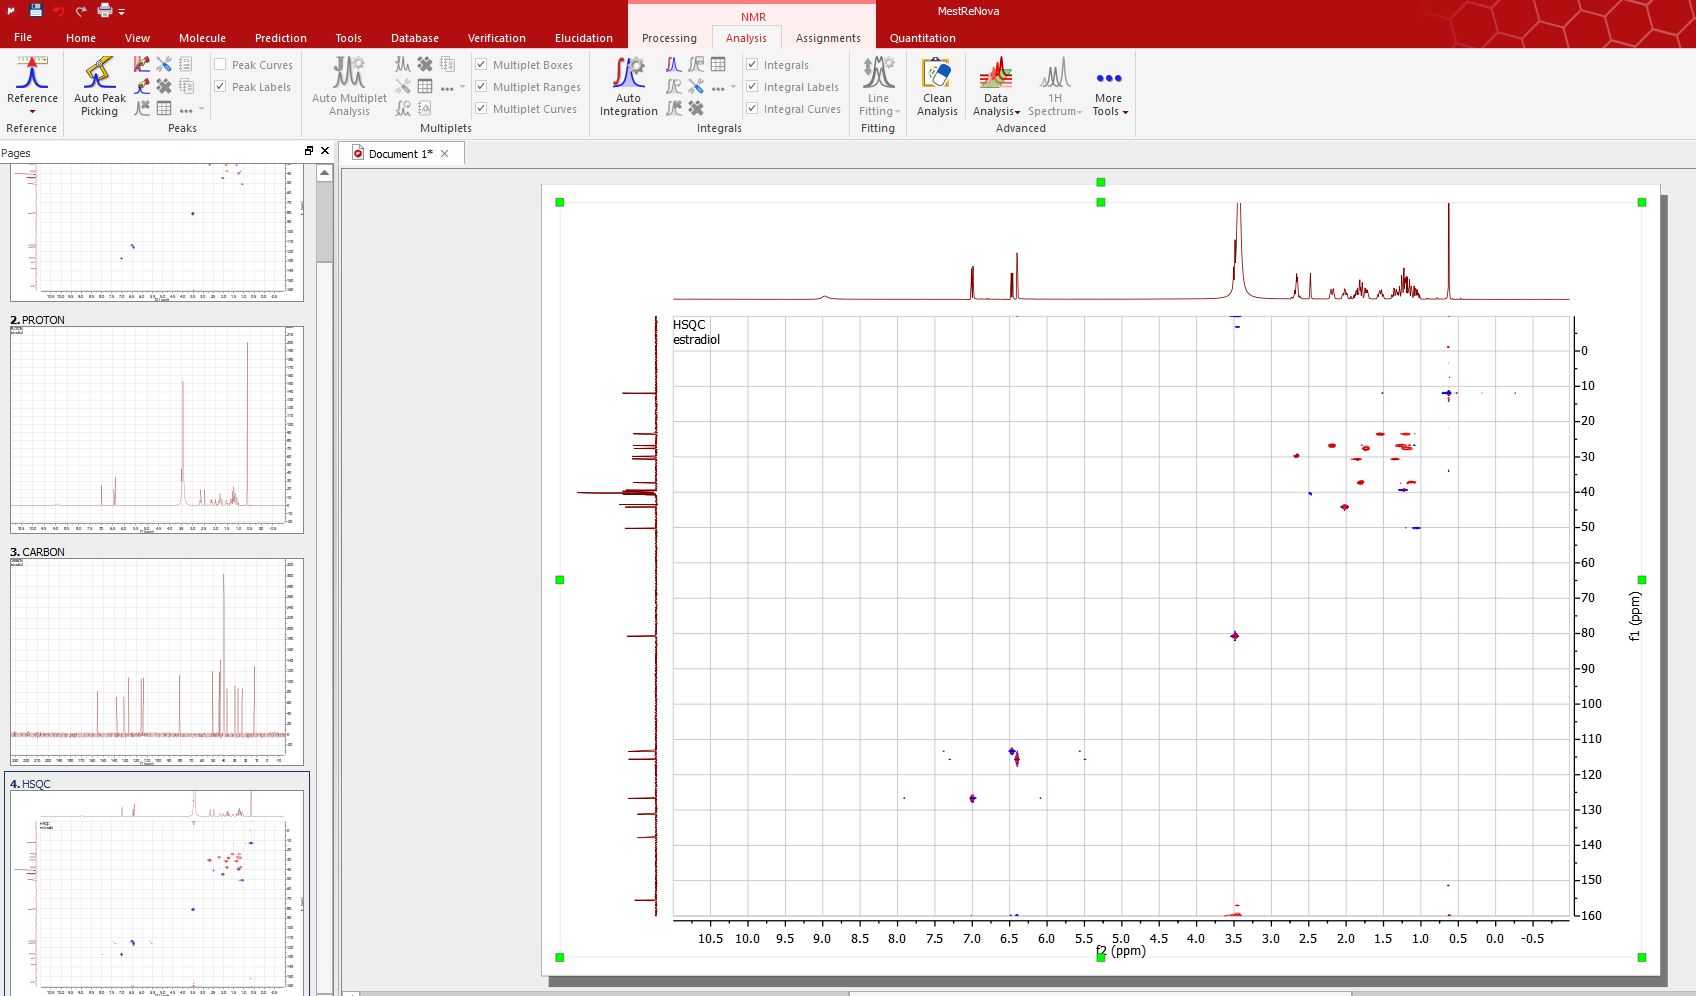
Here you can see the result:
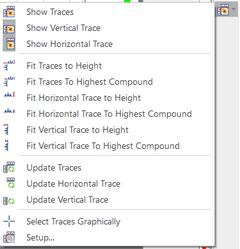
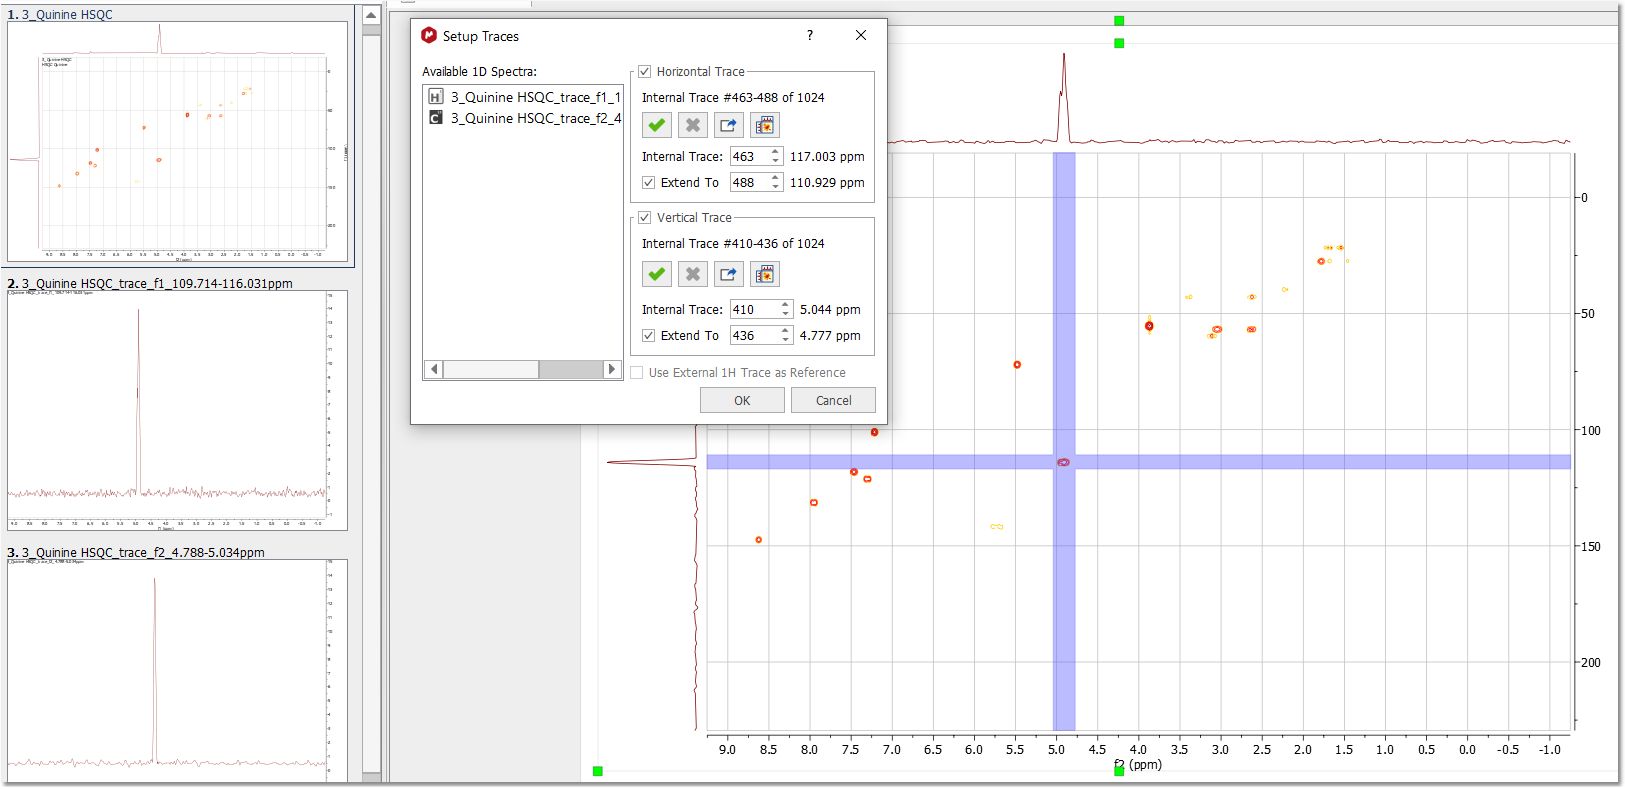
There is also a script under the menu 'Tools/NMR Tools/Auto Attach Traces' which will automatically setup the 1D spectra as external traces of a 2D. You can also choose any currently opened 1D-NMR spectrum as a trace by clicking on ‘Setup’ on the ‘Show Traces’ scroll bar menu (or by using the traces contextual menu by right clicking over one of the traces).
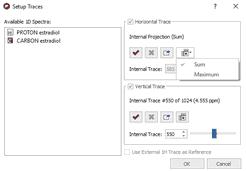
and next selecting the desired 1D-NMR spectrum for the horizontal and then for the vertical trace.
The user will be able to remove the external trace by clicking on the 'Delete' icon You can show the 'Internal Projections' in 2D spectra as either a calculation of the sum of all traces across a given dimension (Sum) or by computing the maximum of every trace (Maximum), just by clicking on the 'Projections icon'
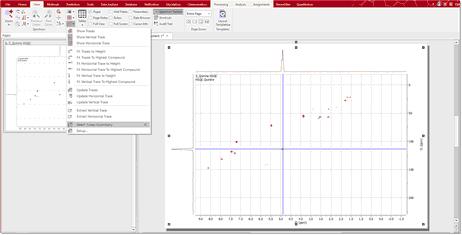
The user can also select the traces directly from the 2D-NMR spectrum by using the 'Select Traces Graphically' tool (shortcut: G) in the 'Show Traces' scroll bar menu. By pressing the key several times the tool toggles between both dimensions, only horizontal and only vertical (as it works for Zoom and Cut tools). Clicking and dragging will extract the sum of the traces of the selected region.
You can also extract a trace without adding it previously as a horizontal/vertical trace in the 2D spectrum using the Select Traces cursor and keeping 'Shift' key pressed. It allows you to select just one trace (horizontal or vertical) or 2 traces (one at each dimension) just with one click. The selected traces are extracted and added to new pages in the document.
Each extracted spectrum contains the title of the original 2D spectrum and additionally the dimension and position of the extracted slice.
You can also extract the sum of several slices of the closest points around a signal by clicking&dragging, instead of just clicking a position, while keeping 'Shift' pressed:
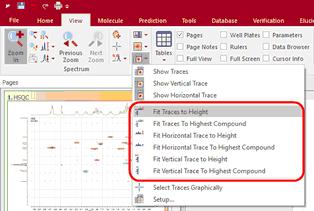
The user will be able to 'Fit Traces to Height' (the vertical, the horizontal or both), just by following the menu 'View/2D Traces' or by using the 'Show Traces' scroll bar menu on the left vertical toolbar:
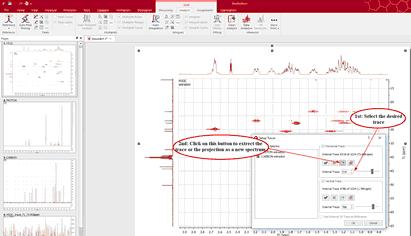
The user can also extract a current trace (or projection) as a new spectrum by clicking on the button
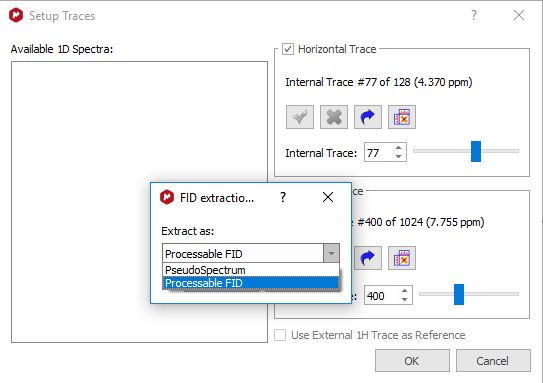
You can extract the vertical trace in a 2D spectrum and apply a FT on it. To get it: - load a 2D spectrum and select "Spectrum after 1st FT" (from the 'Processing/Break Processing on' menu). - select the slice to extract with "select traces graphically" and then open "setup" dialog for traces. - if select "Extract current Vertical Trace as New Item" a new dialog is open. You can get the trace as "PseudoSpectrum" (not posibility FT) or "Processable FT" (posibility to do FT):
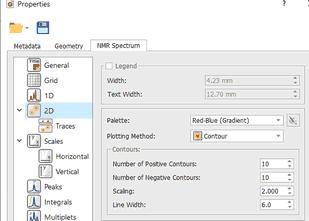
The user will be able to add or remove the 1D traces frame from the 'Grid Properties' dialog box (displayed by double clicking on the 2D-NMR spectral window):
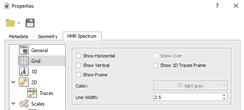
You can select the size of the traces (or to show them by default) by selecting the applicable option on the 'Properties' dialog box:
You can move the traces across the 2D spectrum to freely to compare peaks, as floating traces:
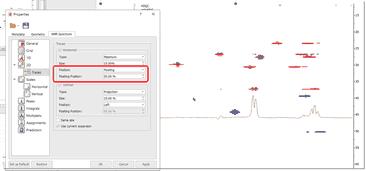
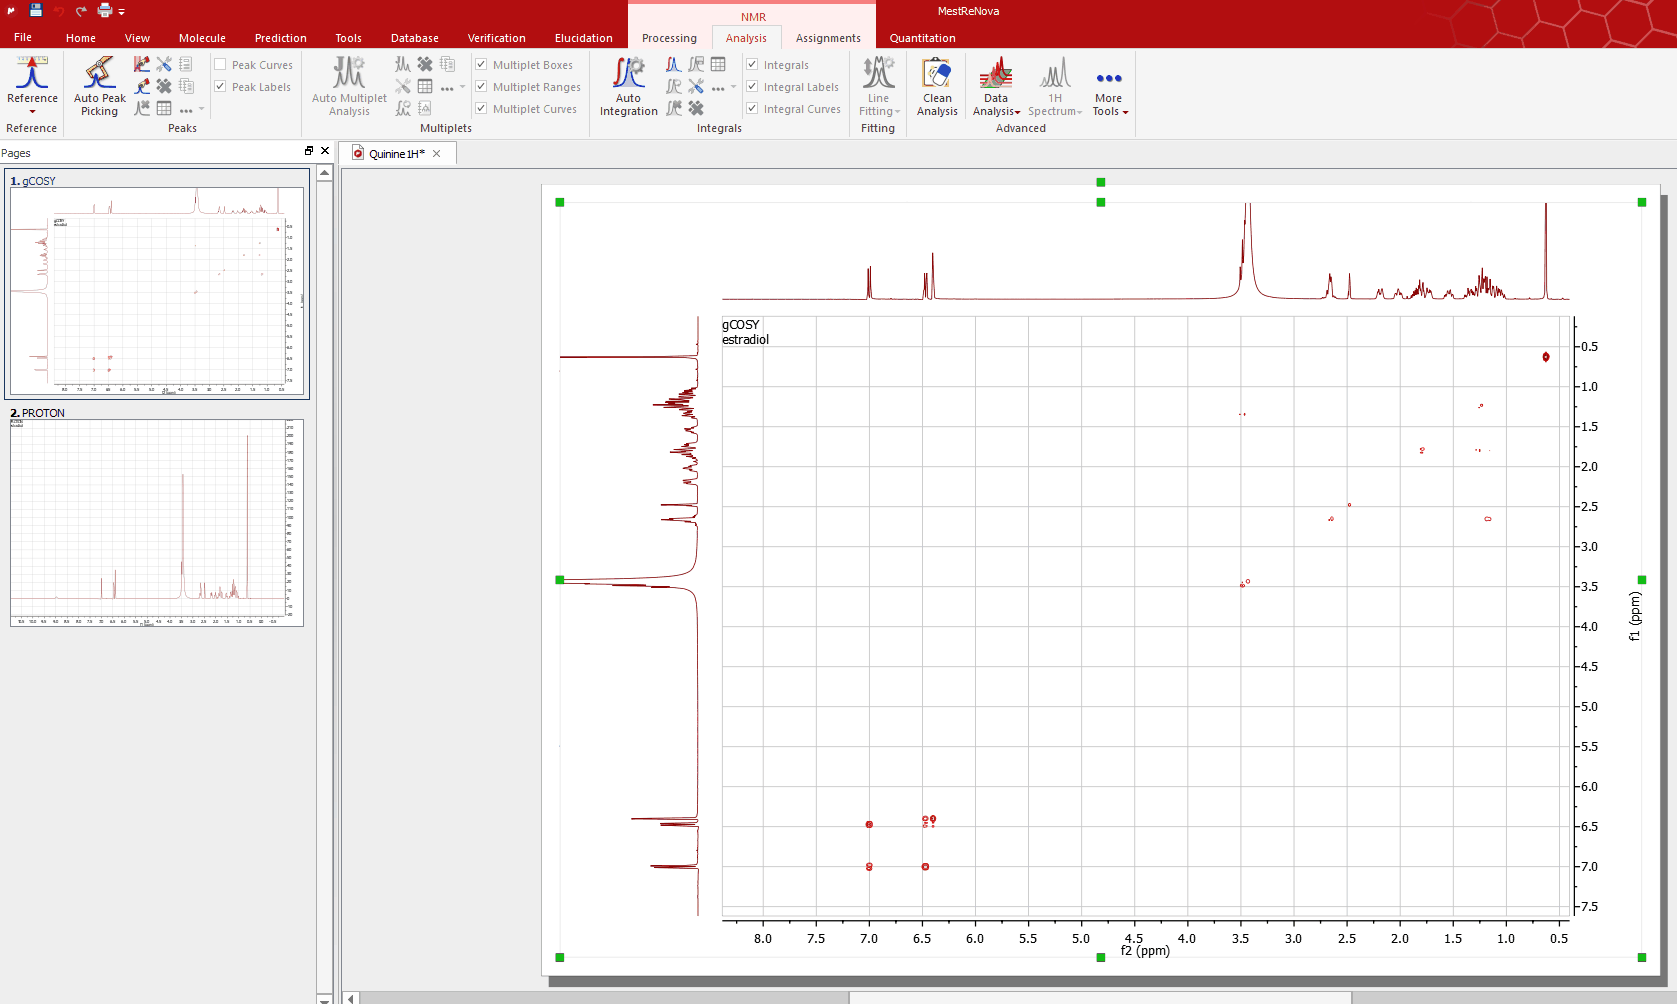
Make sure that the "Use current expansion" property is checked and you could see the Sum and Maximum traces of only those peaks displayed in the zoom region. Automatic reference of 2D-NMR spectra with the 1D external trace. You can reference the 2D-NMR spectra directly with the 1D external trace. Currently this feature only works which those bidimensional experiments which internal traces are equivalent with the external ones. For example: COSY, NOESY, etc... Let´s see how this feature work with a unreferenced COSY spectrum:
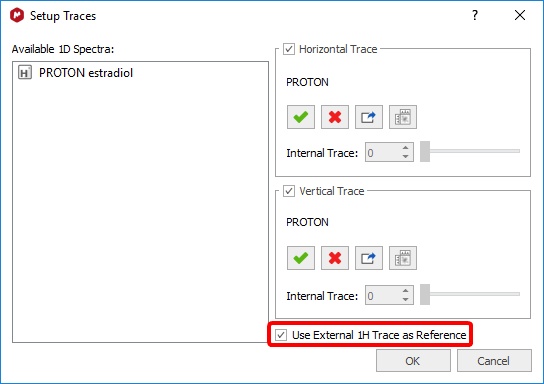
As you can see, this spectrum is not referenced. To apply an automatic referencing, just right click on one of the traces and select 'Setup' to display the 'Setup Traces' dialog box. Once there, select the desired external trace and check the applicable box (highlighted in red in the picture below):
Automatically, you will obtain your COSY spectrum referenced, as you can see in the screenshot below:
See also: Miniclip of this functionality at this Link |