Fast Visual Guide to process routine 2D-NMR datasets


Fast Visual Guide to process routine 2D-NMR datasets |
|
|
(Not available in Mnova Lite) You will find the quinine datasets by following the menu 'File/Help/Download Example datasets'.
The procedure to process a 2D-NMR spectrum is very similar with the monodimensional one: 1. Drag&drop the folder containing the spectral files or click on the 'File/Open' button
2. Mnova automatically detects the 1D spectra and use them as external traces of a 2D plot if the applicable option is checked under the 'File/Preferences/NMR/Import' menu.
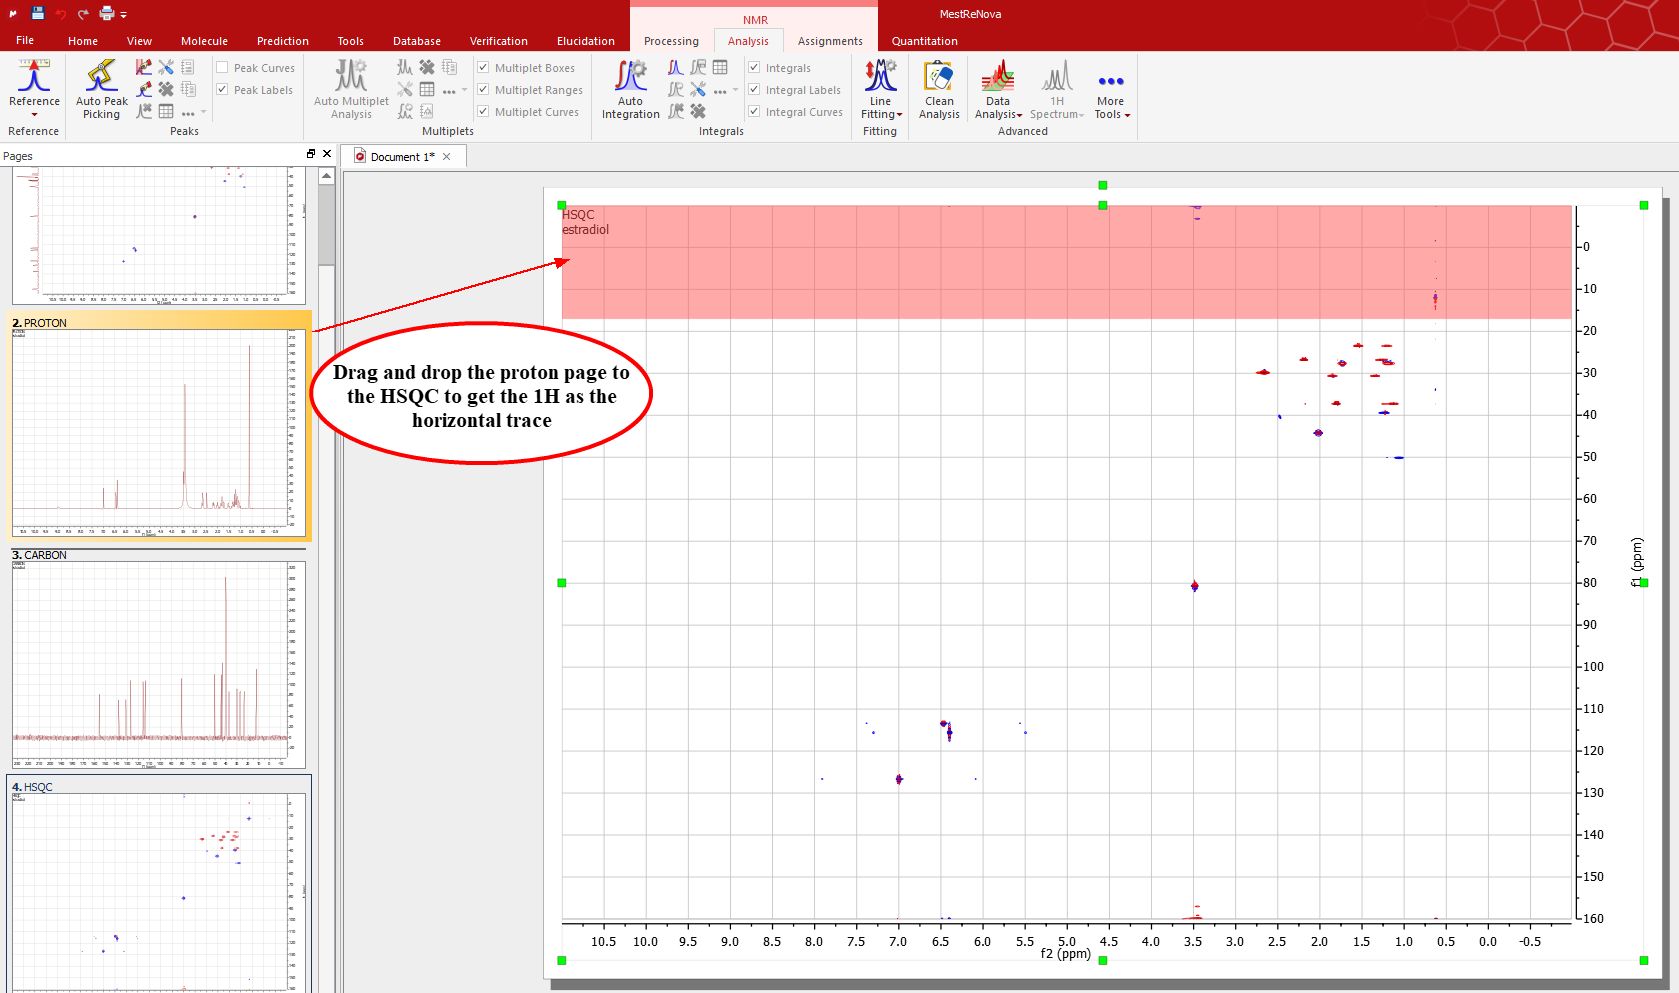
If the 'Auto Attach Traces' option is not checked, you can drag and drop any currently opened 1D-NMR spectrum to a 2D NMR dataset in order to get them as traces. Here you can see how the page number 1, containing a 1H dataset is dropped to the HSQC to get the horizontal trace:
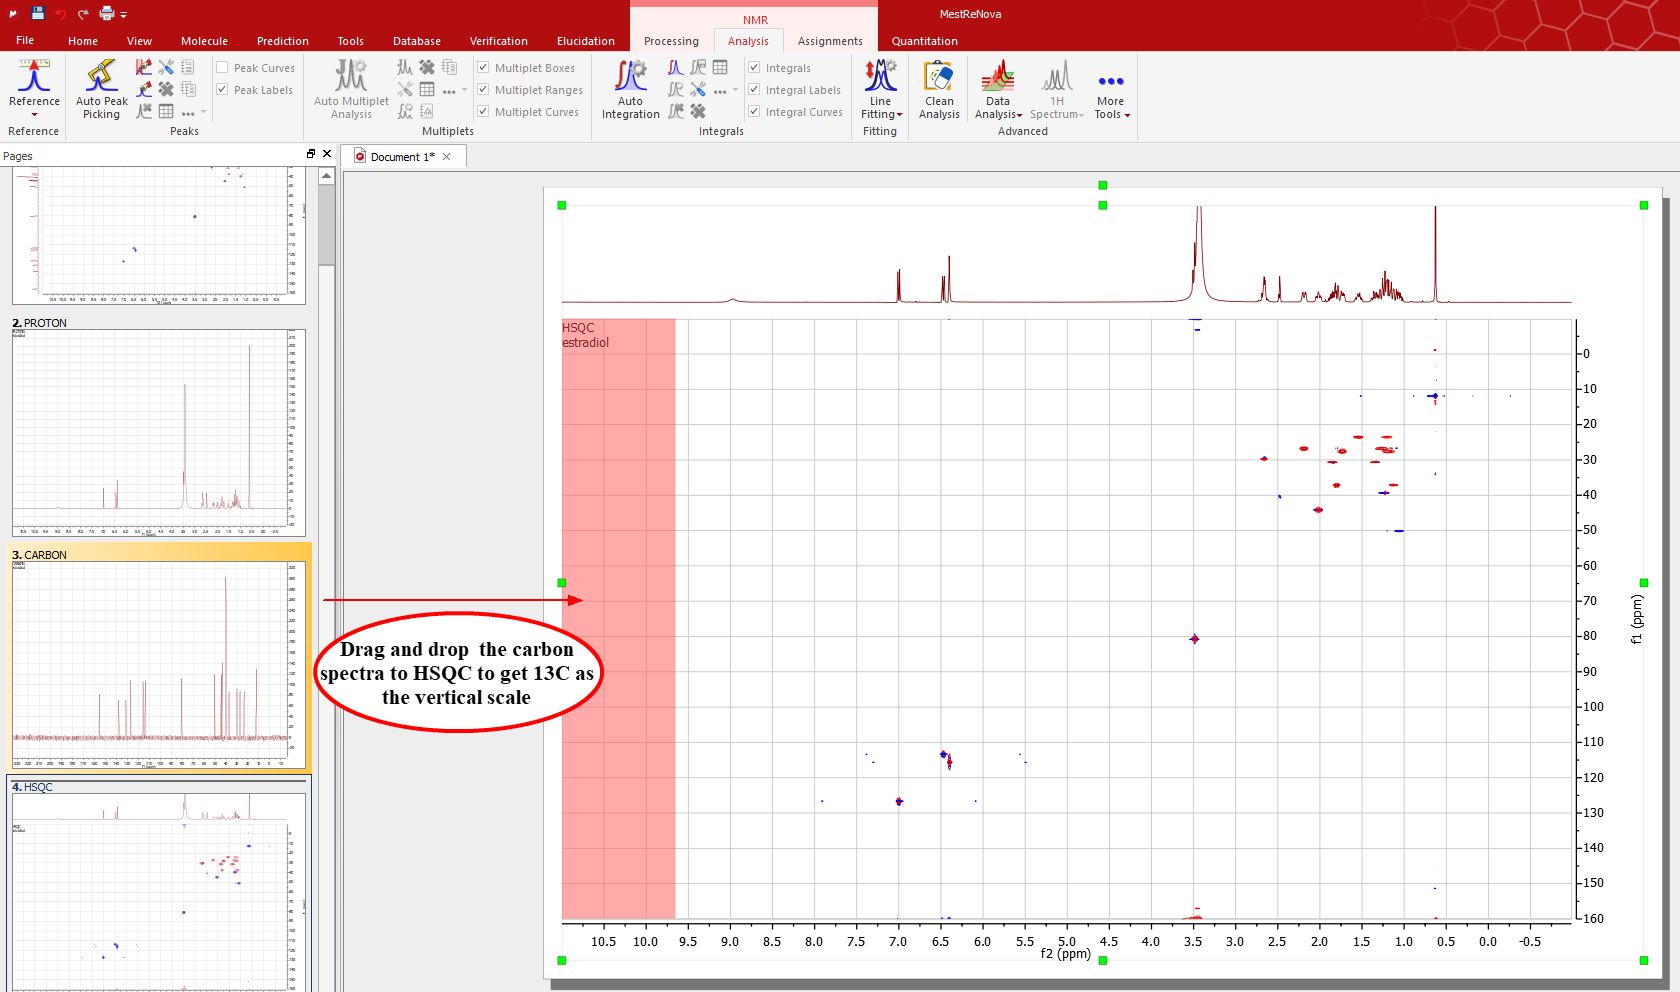
The same can be done with the page 2 (containing a 13C spectrum) to get the vertical trace:
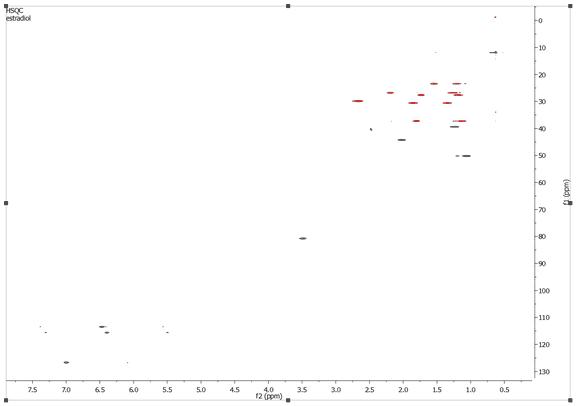
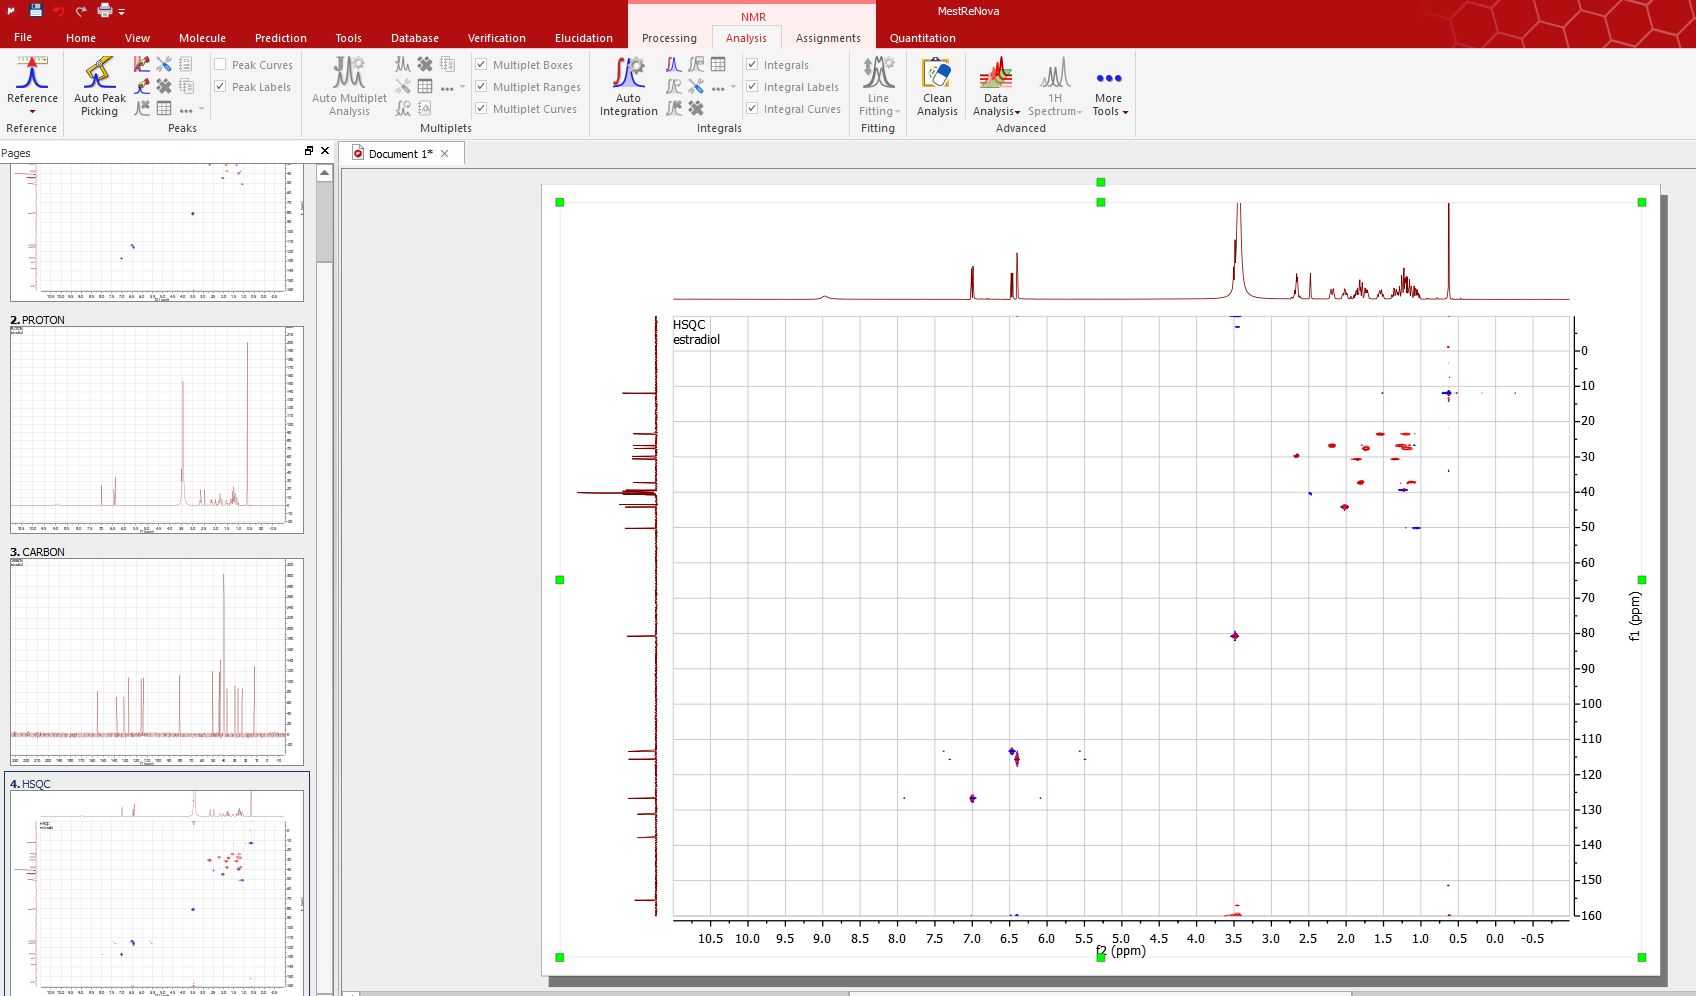
Here you can see the result:
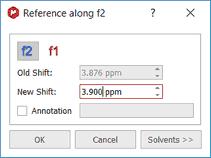
3. To calibrate your spectrum, just click on the 'Reference' toolbar button
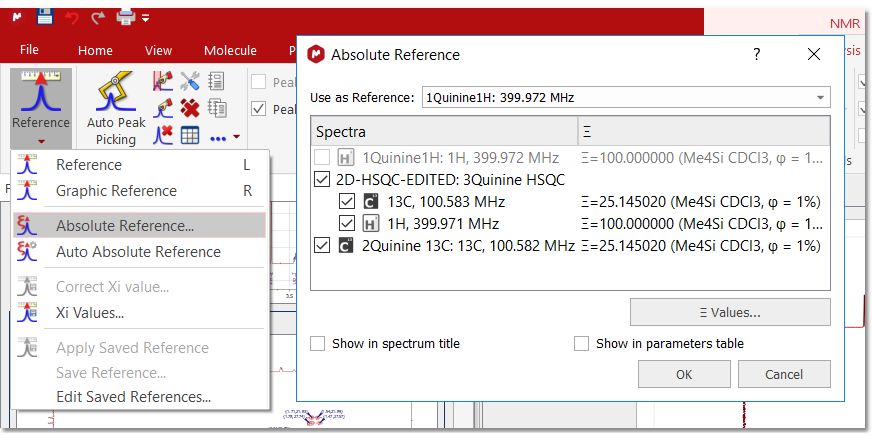
If you have your 1H and 13C NMR spectrum loaded, you can use the 'Absolute Reference' feature to reference 2D & C-13, by clicking on the 'Absolute Reference' button of the toolbar (or by following the menu 'Analysis/Reference/Absolute Reference'):
4. Click on the 'Peak Picking' icon
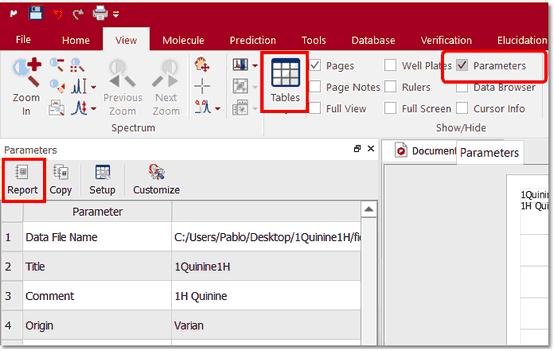
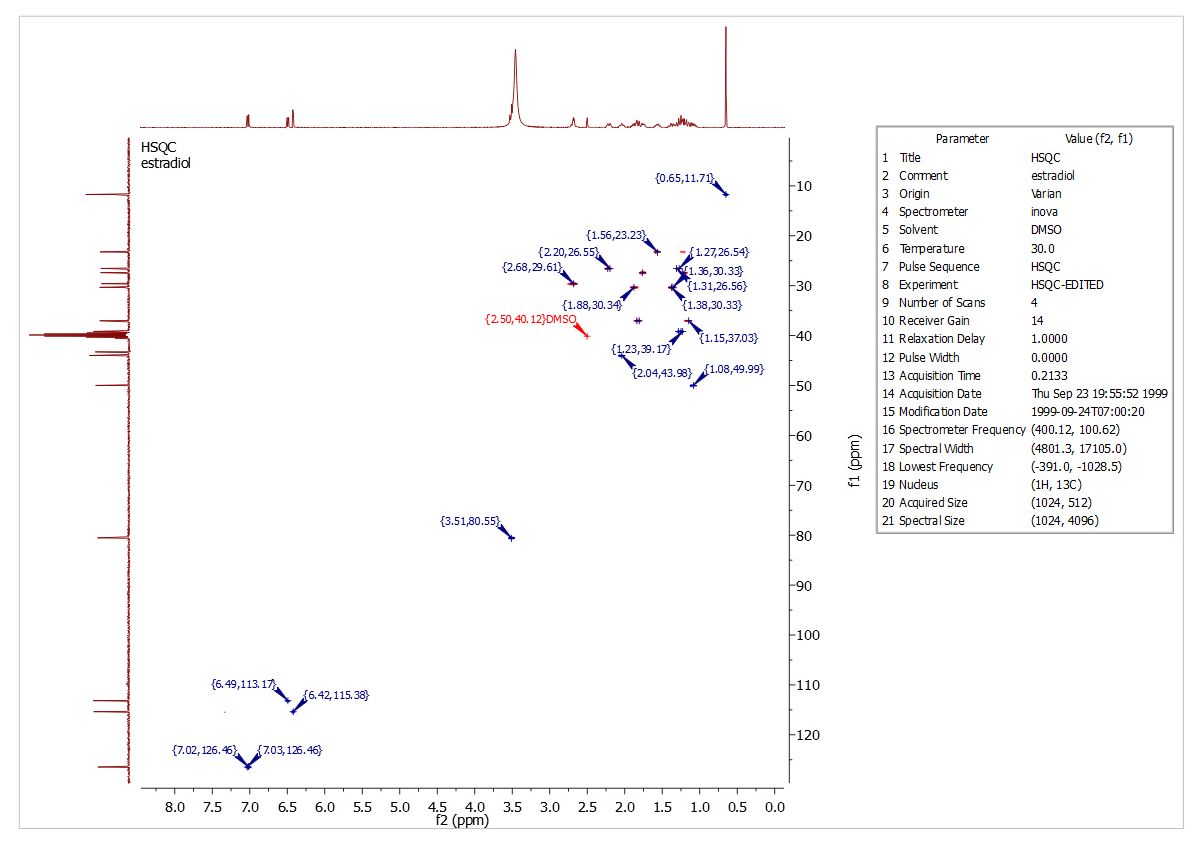
5. Then, click on the 'Report' button to paste the table on your page and move it to the right (by clicking&dragging). Finally resize the 2D spectrum to get the report below:
See also: Fast Visual Guide to process routine 1D-NMR experimental dataManual Phase Correction in 2D-NMR Watch a miniclip on this functionality at this link |