所有脚本都位于 examples/scripts 安装目录下。本章将介绍其中的一些脚本。请注意,您可以通过命令行运行脚本,只需键入 Mnova .exe 文件和脚本所在的路径以及 -sf "脚本函数名称": "mestrenovaPathname" "scriptPathname" -sf "scriptFunctionToRun" 即可。
例如
"C:\Program Files\Mestrelab Research S.L\MestReNova\MestReNova.exe" "C:\Program Files\Mestrelab Research S.L\MestReNova\scripts\myScript.qs" -sf "myFunction" 也可以指定参数:
"C:\Program Files\Mestrelab Research S.L\MestReNova\MestReNova.exe" "C:\Program Files\Mestrelab Research S.L\MestReNova\scripts\myScript.qs" -sf "myFunction",0.1,10,true,off
在这种情况下,MNova 将以指定的参数运行 myScript.qs 中的 myFunction(0.1,10,true, "off")。逗号后无空格!
发送电子邮件 可以发送包含附件的电子邮件(需要在同一台计算机上安装 Python)。
发送电子邮件时会显示一条信息:
testFilePermissions: 该脚本允许您生成 "只读 "文档。
自定义导入处理: 此脚本可用于更改 Mnova 导入 NMR 图谱的方式。例如,停止 FID 中的处理。请按照以下步骤默认设置此脚本: 1: 进入 "Edit/Preference/Scripts(编辑/首选项/脚本)",点击 "蓝色加号按钮 "为样本脚本添加新文件夹。 2: 将此脚本保存为 .qs 文件,放入上述文件夹。 3: 重新启动 Mnova 并加载 1H-NMR 数据集。您将得到未经任何处理的波谱(仅有 FID)。
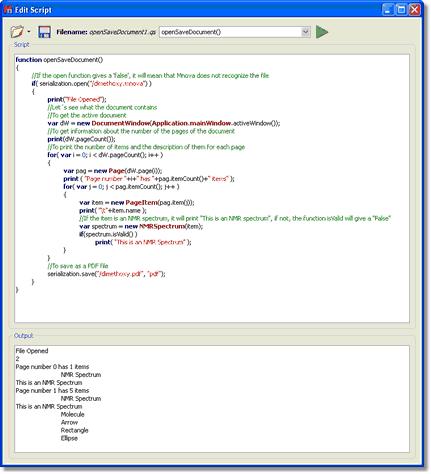
打开并保存文档脚本:让我们来看看一个简单的脚本,您可以用它打开 .mnova 文件并将其导出为 PDF 文件。在本例中,我们将打开一个名为 "Dimethoxy "的 .mnova 文件:
function openSaveDocument() { //If the open function gives a 'false', it will mean that Mnova does not recognize the file if( serialization.open("/dimethoxy.mnova") ) { print("File Opened"); //Let´s see what the document contains //To get the active document var dW = new DocumentWindow(Application.mainWindow.activeWindow()); //To get information about the number of the pages of the document print(dW.pageCount()); //To print the number of items and the description of them for each page for( var i = 0; i < dW.pageCount(); i++ ) { var pag = new Page(dW.page(i)); print ( "Page number "+i+" has "+pag.itemCount()+" items" ); for( var j = 0; j < pag.itemCount(); j++ ) { var item = new PageItem(pag.item(j)); print( "\t"+item.name ); //If the item is an NMR spectrum, it will print "This is an NMR spectrum", if not, the function isValid will give a "False" var spectrum = new NMRSpectrum(item); if(spectrum.isValid() ) print( "This is an NMR Spectrum" ); } } //To save as a PDF file serialization.save("/dimethoxy.pdf", "pdf"); } }
要运行该脚本,只需将其复制到 "编辑脚本 "对话框,然后在组合框中输入 "openSaveDocument() "即可。请注意,您需要在脚本的第 4 行写入保存的 Mnova 文件的相应路径(在本例中,dimethoxy.mnova文件保存在 C:\ )。 在脚本中可以看到,如果 Mnova 无法识别频谱,就会在语句的输出中出现 "False "信息: if( serialization.open("/dimethoxy.mnova") )
print("File Opened");这一行将在输出中给出相应的信息,如下图所示:
变量var dW = new DocumentWindow(Application.mainWindow.activeWindow());的对象 "应用程序 "为我们提供了 "主窗口 "的 "活动窗口",也就是我们可以在屏幕上看到的文档。函数print(dW.pageCount());用于了解文档的页数。
脚本的以下几行用于获取文档中包含的项目信息。例如,函数pageCount用于了解文档的页数。变量var pag = new Page(dW.page(i));将逐页分析以查找相关信息。print ( "Page number "+i+" has "+pag.itemCount()+" items" );这一行将在输出中打印相应的短语,紧跟页码(+i+)和页面中包含的条目数 for( var j = 0; j < pag.itemCount( ); j++ ).变量var item = new PageItem(pag.item(j));将告知项目的类型,函数print( "\t "+item.name );将打印项目的名称。在本例中(如下图输出所示),文档有 2 页;第 0 页有 1 个条目,即核磁共振波谱;第 1 页有 5 个条目(核磁共振波谱、分子、箭头、矩形和椭圆)。
变量 spectrum = new NMRSpectrum(item);将重建活动频谱,如果项目是核磁共振频谱,它将打印 "This is an NMR spectrum"(这是一个核磁共振频谱),如果不是,函数 isValid 将给出一个 "False"(假) ,因为有以下几行:if(spectrum.isValid() ) // print( "This is an NMR Spectrum" );.
最后,serialization.save("/dimethoxy.pdf", "pdf");插件会将文档以 PDF 文件格式保存在硬盘的指定位置(在本例中,PDF 文件将保存在 C:\)。
用分子打开波谱 使用 openSpecWithMols.qs 示例脚本可以打开带分子的波谱。您需要将脚本所在目录添加至 "脚本目录"(使用 "文件/首选项/脚本/脚本目录 "菜单)。然后重启 Mnova,在命令行中键入以下内容即可运行脚本: "MestReNova 路径" -sf openSpecWithMols, "Spectrum 路径"。
例如
"C:\Program Files\Mestrelab Research S.L\MestReNova\MestReNova.exe" -sf openSpecWithMols,"C:\1H\fid
其中,黄色是您安装 Mnova 的路径,红色是您要打开的波谱的路径。
// Opens a spectrum at aSpecPath and all the molfiles located in the same directory function openSpecWithMols(aSpecPath) { var dirPath = File.absDirPath(aSpecPath); var dir = Dir(dirPath); dir.cdUp(); var files = getMaskFiles(dirPath, dir.absPath, "*.mol", "*", false); files.push(dirPath); serialization.open(files); }
导入_处理_保存_循环脚本: 该脚本可用于将先前存在的 "全处理 "模板(此处为保存在 C:/temp/proc.mnp 中的模板)应用于多个波谱(保存在 C:/spectra/ 和扩展名为".fid "的子文件夹内,例如:"C:/spectra/1H.fid"),并将结果保存为不同的文件格式(.mnova、.pdf 和 .txt)。该脚本仅对包含 FID 文件的波谱有效。
/****************************************************************************************************** Copyright (C) 2007 Mestrelab Research S.L. All rights reserved.
This file is part of the MNova scripting toolkit.
Authorized users of MNova Software may use this file freely, but this file is provided AS IS with NO WARRANTY OF ANY KIND, INCLUDING THE WARRANTY OF DESIGN, MERCHANTABILITY AND FITNESS FOR A PARTICULAR PURPOSE. *****************************************************************************************************/ // This example function demonstrates how to apply some processing to a set of spectral files and to save the result in the different file formats. function import_process_save_loop() { const dirName = "c:/spectra"; // Source directory with spectra to be processed. const resultDirName = dirName; // Destination directory where processed spectra should be put. const procName = "c:/temp/proc.mnp"; // Processing file. It must be created in the Full Processing dialog of MestReNova. const fileMask = "fid"; // This mask specifies files to be processed. const dirMask = "*.fid"; // This mask specifies directories to be scanned for spectra.
var dir = new Dir(dirName); if (!dir.exists) { MessageBox.critical("Directory " + dirName + " does not exist.",MessageBox.Ok); return; } dir.cdUp();
// The below function getMaskFiles is located in the files.qs script. // If you run import_process_save_loop from QSA Workbench then it is necessary to introduce getMaskFiles to the interpreter by importing files.qs. var files = getMaskFiles(dirName, dir.absPath, fileMask, dirMask, true); for(var i = 0; i < files.length; i++) { var dw = new DocumentWindow(Application.mainWindow.newWindow()); // Create new document window if (serialization.open(files[i])) { nmr.process(procName); const toReplace = new RegExp("[/|:]", "g"); fileName = resultDirName + "/" + files[i].replace(toReplace, "_"); // Generate a filename for processed spectrum. serialization.save(fileName+".mnova", "mnova"); // MestReNova file format serialization.save(fileName+".pdf", "pdf"); // Adobe PDF file format serialization.save(fileName+".txt", "ascii"); // ASCII print(fileName); // Prints file name in the debug window } dw.close(); // Close document window of processed spectrum } }
参数脚本: 该脚本可用于获取频谱上所需的参数。只需使用 HTML 代码,您就可以添加或删除任何参数并更改字体。
函数 spectrumParams() { var spec = new NMRSpectrum( nmr.activeSpectrum() ); var htmlText = "<b>核</b>:%1 <br/> <b>频率:</b> %2 <br/> <b>脉冲序列:</b> %3 <br/> <b>psLabel: </b> %4 <br/> <b>溶剂:</b> %5 <br/> <b>标题:</b> %6"; var nuc = spec.getParam("Nucleus[1]"); var freq = spec.getParam("Spectrometer Frequency"); var seqfill = spec.getParam("Pulse Sequence"); var psLabel = spec.getParam("psLabel"); var Solvent = spec.getParam("Solvent"); var Title = spec.getParam("Title"); print(spec.getParam("Nucleus[1]"); print(spec.getParam("Spectrometer Frequency")); print(spec.getParam("Pulse Sequence")); print(spec.getParam("psLabel")); print(spec.getParam("Solvent")); print(spec.getParam("Title")); htmlText=htmlText.arg(nuc).arg(freq).arg(seqfill).arg(psLabel).arg(Solvent).arg(Title); draw.text(htmlText, true); }
在这种情况下,脚本将打印参数 "核"、频谱频率、脉冲序列、psLabel、溶剂和标题。请注意,getParam 函数只返回参数表中存在的参数(包括不可见参数)。请确保参数表中包含这些参数(通过自定义对话框)。
FID 测试脚本: 通过运行此脚本,您将获得有关 FID 实部和虚部的信息:
函数 fidTest() { var spec = new NMRSpectrum( nmr.activeSpectrum() ); print(spec.fidImag(0)); if( spec.fidSetImag(0,0) ) print(spec.fidImag(0)); print(spec.fidReal(0)); if(spec.fidSetReal( 0, 0 ) ) print(spec.fidReal(0)); spec.process(); mainWindow.activeWindow().update(); }
print(spec.fidImag(0))命令将返回 FID 在aIndex点的虚部值(本例中为 0,您可以键入从 0 到频谱点数的任意数字),而print(spec.fidReal(0));行将给出实部值。对象fidsetImag;设置频谱 fid 的aIndex点的虚值。
积分测试脚本: 该脚本可用于获取频谱积分的相关信息:
函数 integralTest() { var spec = new NMRSpectrum( nmr.activeSpectrum() ); var intList = new Integrals(spec.integrals()); print(intList); print(intList.count); print(intList.normValue);
var myInt = new Integral(intList.at(0)); print(myInt); print(myInt.rangeMax(1)); print(myInt.rangeMin(1)); if( spec.dimCount > 1 ) { print(myInt.rangeMax(2)); print(myInt.rangeMin(2)); }
print("Integral Value "+myInt.integralValue()); print("Normalized value "+myInt.integralValue(intList.normValue));
var sReg = new SpectrumRegion(7.2, 7.5); var newInt = new Integral( spec, sReg, false ); print(newInt); print(newInt.integralValue()); spec.integrals().append(newInt); spec.process(); }
脚本的第一部分用于计算积分,并报告应用于积分的归一化值(在列表 "intList "中)。通过脚本的第二部分,用户可以选择列表中的任意积分(在本例中,用户可以选择出现在第一个位置的积分,如果要选择第二个积分,则应键入var myInt = new Integral(intList.at(1)); )。然后,脚本会返回所选积分的绝对值和极限值。脚本的第三部分返回积分的绝对值和归一化值。
脚本的最后一部分可用于向列表中添加一个新积分(本例中是一个波谱区域为 7.2 至 7.5 ppm 的积分),脚本将报告该积分的绝对值。
多重测试脚本:该脚本可用于获取波谱中的多重谱信息,也可用于 "手动多重谱分析":
函数 multipletTest() { var spec = new NMRSpectrum( nmr.activeSpectrum() ); print(spec.multiplets()); var sMult = new Multiplets(spec.multiplets()); print(sMult.count); print(sMult.at(2));
var sReg = new SpectrumRegion(7.0, 7.5); var mult = new Multiplet( spec, sReg ); var myMultiplets = new Multiplets(); myMultiplets.append( mult );
var mult2 = new Multiplet( spec, new SpectrumRegion(3.80,3.90) ); myMultiplets.append( mult2 );
var nM = new Multiplet(new SpectrumRegion(3.65,3.75), "t"); nM.name="My mulltiplet"; myMultiplets.append(nM);
print(myMultiplets); spec.setMultiplets(myMultiplets); print(spec.multiplets()); spec.process(); }
脚本的第一部分创建了频谱上出现的多重子列表,并打印了所选多重子的一些信息(在本例中,多重子编号为 2,当然也可以选择任何其他多重子)。脚本的第二部分在选定区域 "sReg"(本例中的区域为 7.0-7.5 ppm)内创建一个多重子集。它的工作原理与手动多重分析相同)。然后,脚本会创建一个新的空白多重序列列表,并将其添加到列表中。
脚本的第三部分包括一个新的区域(从 3.80 到 3.90 ppm)以应用多 重分析。脚本的下一部分用于手动向多重子列表中添加多重子(用户可以删除脚本的这一部分, 不会有任何问题)。在本例中,我们希望添加一个出现在 3.65 和 3.75 ppm 区域的三重体,并命名为 "我的多重体"。
脚本的末尾用于用我们刚刚创建的列表替换原来的多体列表。
峰值测试脚本: 类似的脚本用于获取一维核磁共振谱图中峰的化学位移和强度信息:
函数 peakTest() { var spec = new NMRSpectrum( nmr.activeSpectrum() ); var sR = new SpectrumRegion( 0, 9.5 ); var ps = new Peaks(spec, sR); //fill the list with the peaks in sR print(ps); var p = new Peak(1.265, spec); print(p); ps.append(p); spec.setPeaks(ps);//Set the peaks to ps print( spec.peaks()); spec.process(); }
运行此脚本后,我们将获得从 0 到 9.5 ppm 的 1D-NMR 波谱的选峰分析结果(当然,我们可以更改此范围)。然后,一个位于 1.265 ppm 的新峰将被添加到峰值列表中(如果需要,也可以添加任何其他峰值),并报告这个新峰的强度值。最后,将重新分析波谱以获得新的峰值数。
类似的脚本也可用于 2D-NMR 波谱,但在这种情况下,我们必须在 2D 模式下键入相应的波谱区域:
函数 peakTest() { var spec = new NMRSpectrum( nmr.activeSpectrum() ); var sR = new SpectrumRegion(4.0, 3.5, 75, 65 ); var ps = new Peaks(spec, sR); // 用 sR 中的峰值填充列表 print(ps); var p = new Peak(72.73, 3.17, spec); print(p); ps.append(p); spec.setPeaks(ps);//Set the peaks to ps print( spec.peaks()); spec.process(); }
多重报告脚本:现在让我们来看看 "Multiplet Reporter_JACS "脚本中非常重要的一部分:
// 该函数定义了类似 JACS 的多重报告。 // 要定制报告,请编辑该类或实现其他类。 函数 JACSMultipletReporter()
}
JACSMultipletReporter.prototype = new MultipletReporter(); JACSMultipletReporter.prototype.toString = function() { return "JACSMultipletReporter()"; }
(...)
The user will be able to change the multiplet report template to obtain the desired multiplet report; for example:
this.onlyElementName=false; changing false with true, we will obtain only the element name without the atomic mass (For example: H, C instead of 1H, 13C).
The function: this.font = "<font style=\"font-size: 10pt; font-family: Times New Roman\">"; will define the font size and the font family of the multiplet report.
The line: this.header = "%1 NMR (%2 MHz, %3) δ "; is used to print the header of the report, where %1 will be the nucleus (H or C), %2 the frequency of the spectrometer (in MHz), and %3 the solvent, followed by a delta symbol (δ). For example: "1H NMR (500 MHz, CDCl3) δ".
The sentence: this.reportRange = true is used to obtain the multiplet range instead of the chemical shift.
The functions: this.withoutJsTemplate = " %1 (%2, %3H)" and this.withJsTemplate = " %1 (%2, %4, %3H)" are used to customize the appearance of the multiplet report by changing the positions of %1, %2, %3H, or %4 (where, %1 means: chemical shift; %2 means: type of multiplet (s, d, t, etc); %3H means: number of hydrogens and %4 means the coupling constant value). As you can see, the first line shows a multiplet without coupling constants, (while the last line shows a multiplet with coupling constants).
So, if you need to obtain something like this (Japanese format):
1H NMR (300 MHz, Solvent) δ ppm 6.43-6.22 (1 H, m), 3.17 (1 H, q, J = 7.15 Hz) etc…
You should modify both lines, as you can see below:
this.withoutJsTemplate = %1 (%3H, %2)"; this.withJsTemplate = " %1 (%3H, %2, %4)";
If you prefer to obtain something like this: 1H NMR (300 MHz, Solvent) δ ppm 1.23 (d, J = 1.2 Hz, 3 H), etc… Just replace the original lines with: this.withoutJsTemplate = %1 (%2, %3H)"; this.withJsTemplate = " %1 (%2, %4, %3H)";
To obtain the coupling constant symbol in normal instead of ‘italic’, just modify the script by removing the italic format (<i>J</i>). If you prefer to obtain it in "bold" just type: this.jListTemplate = "<b>J</b> = %1";
The following paragraph will be used to customize the appearance of the coupling constants list:
this.jPrecision = 1; // J's precision this.deltaPrecision = 2; // delta precision this.mSeparator = ", "; // multiplet separator this.jSeparator = ", "; // J's separator
The first line is used for the precision of the coupling constants values, the second will be used for the precision of the chemical shift and the remaining two lines will print the separation between the multiplets and the coupling constants values.
If you need to obtain the coupling constants in descending order, replace 'true' with 'false' in the following line: var jList = new JList(multiplet.jList()); jList.sort(true); If you want to obtain the multiplet chemical shifts in ascending order, just replace the 'false' with 'true' in the script: var multiplets = new Multiplets(spectrum.multiplets()); // get multiplets from spectrum jList.sort(true); To obtain the multiplet range in ascending order, just replace the rangeMin with rangeMax (and vice versa) in the line below of the script: shiftStr = this.rangeTemplate.argDec(multiplet.rangeMax, 0, 'f', this.deltaPrecision).argDec(multiplet.rangeMin, 0, 'f', this.deltaPrecision);
Title and Solvent: running this script, you will get the title and the solvent on your spectrum
// <GUI menuname="title1" shortcut="Ctrl+2" tooltip="Title_and_Solvent" /> function title1() { //To get the active spectrum var spectrum = nmr.activeSpectrum(); //The function isValid informs about if the spectrum obtained is correct print( spectrum.isValid() ); var tit = draw.text("<h3>"+ spectrum.title+" "+spectrum.solvent+"</h3>", true);
}
Zoom: This script can be used to apply a zoom into a selected range of a spectrum. In order to select the horizontal range, just type the desired values between the brackets on the line spc.horZoom(1.0, 5.0);
If you want to set the vertical zoom, just change the values of the line spc.vertZoom(-100, 7000)
function spectrumZoom() { var spc = nmr.activeSpectrum(); if( !spc.isValid() ) return; spc.horZoom(1.0, 5.0); spc.vertZoom(-100, 7000); spc.update(); mainWindow.activeWindow().update(); }
Properties Script: You will find below a script example to change some properties of your spectra. In this case, the colour of the spectrum will be changed to red, the peaks font to Arial and the integral curves will be showed. You will find all the available properties at the 'Mnova Properties' chapter:
function properties() { var spec = new NMRSpectrum(nmr.activeSpectrum());
spec.setProperty("curve.color","red"); spec.setProperty("peaks.font","Arial"); spec.setProperty("integrals.curve.show", true); spec.update(); mainWindow.activeWindow().update();
}
Cutting: This script can be used to apply cuts to the spectra. You will obtain two cuts in your spectrum, between 1.0-3.5 and 7.0-8.0 ppm respectively.
}
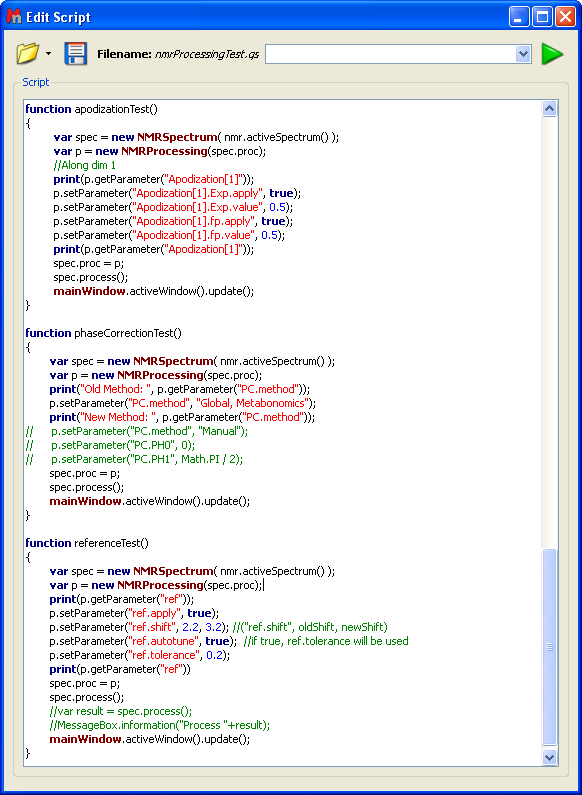
Processing script: Here you can see a part of the 'mnrProcessingTest" script stores under the examples folder:
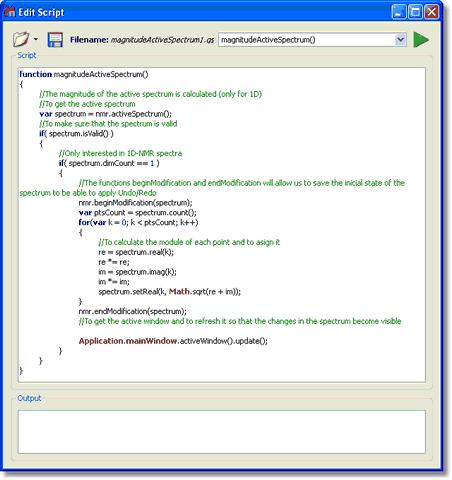
Magnitude Active Spectrum script: Let´s see another script; in this case this script is used to obtain the 1D-NMR spectra in magnitude. Just open a 1D-NMR spectrum in Mnova, load this script by following the menu 'Script/Edit Script', type "magnitudeActiveSpectrum()" in the edit box and click on the green triangle to run the Script. You will obtain automatically your 1D-NMR spectrum in magnitude.
Please bear in mind that it is also possible to run scripts from the command line, just by typing the path where the Mnova .exe file and the script are located and -sf "name of the script function": "mestrenovaPathname" "scriptPathname" -sf "scriptFunctionToRun"
For example:
"C:\Program Files\Mestrelab Research S.L\MestReNova\MestReNova.exe" "C:\Program Files\Mestrelab Research S.L\MestReNova\scripts\magnitudeActiveSpectrum.qs" -sf "magnitudeActiveSpectrum"
Threshold Script: This script will allow the user to adjust the threshold of the color scheme in 2D-NMR spectra:
// <GUI menuname="threshold2D" shortcut="Ctrl+T" tooltip="threshold2D" /> function threshold2D() { var spectrum = nmr.activeSpectrum(); if(!spectrum.isValid() ) return
var th = spectrum.threshold;
var dlg = new Dialog(); dlg.title = "Threshold";
var edit = new LineEdit(); edit.label = "Threshold"; edit.text = th; dlg.add(edit); if (dlg.exec()) { spectrum.threshold = edit.text; } spectrum.update();
mainWindow.activeWindow().update(); }
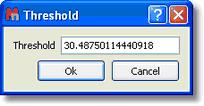
Running this script will show the 'Threshold' dialog box. From this window, the user will be able to adjust the threshold of the colour scheme by just typing the desired value and clicking on the 'OK' button.
ProcessTest Script: This script can be used to get some data from Mnova, save it as a file, next run some external program in order to make calculations (or whatever you need) and once the external program finishes, Mnova will get the result from another file. In this case the external program is the 'NotePad'.
function processTest() { fileName = Dir.temp() + "MNova_Process_Text.txt"; var f = new File(fileName); f.open(File.WriteOnly); var s = TextStream(f); s.write("Hello Notepad!"); f.close(); print(Process.execute("notepad.exe", fileName));
f.open(File.ReadWrite); s.pos = f.size; print(s); s.write("\r\nHi again!"); f.close(); print(Process.startDetached("notepad.exe", fileName)); }
|


