View Results


View Results |
|
|
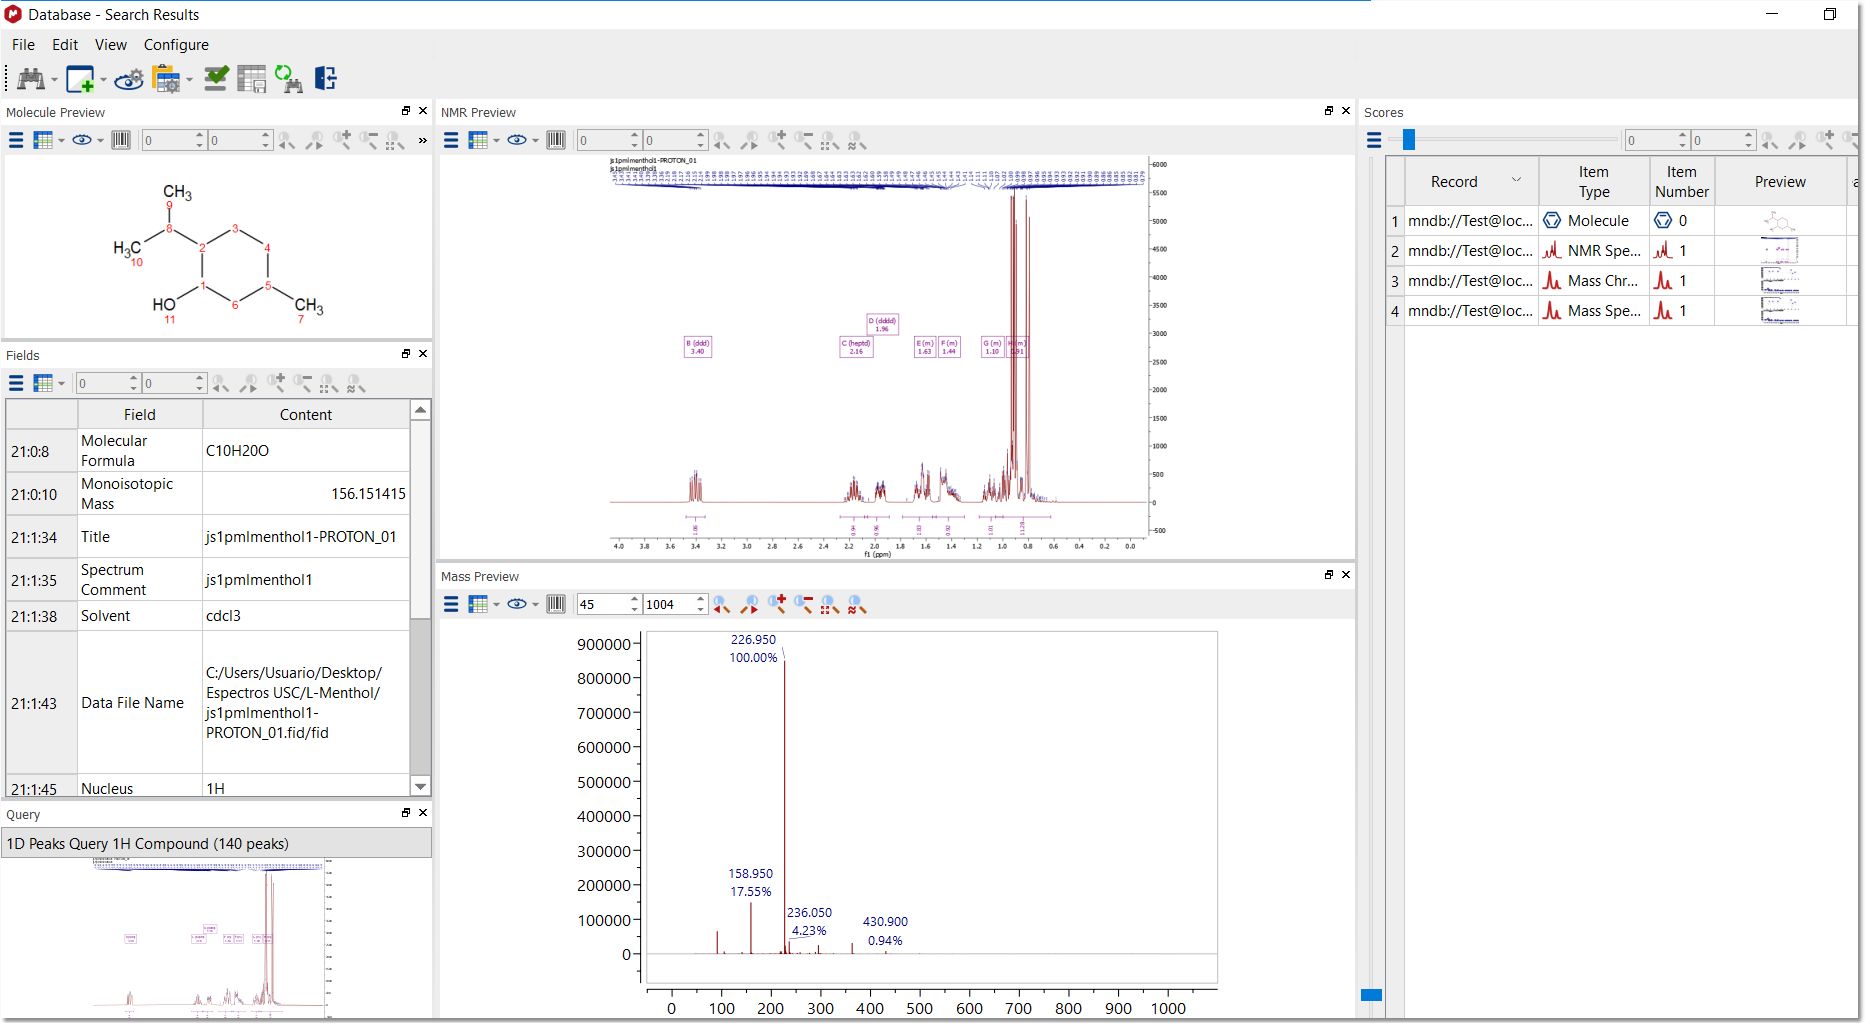
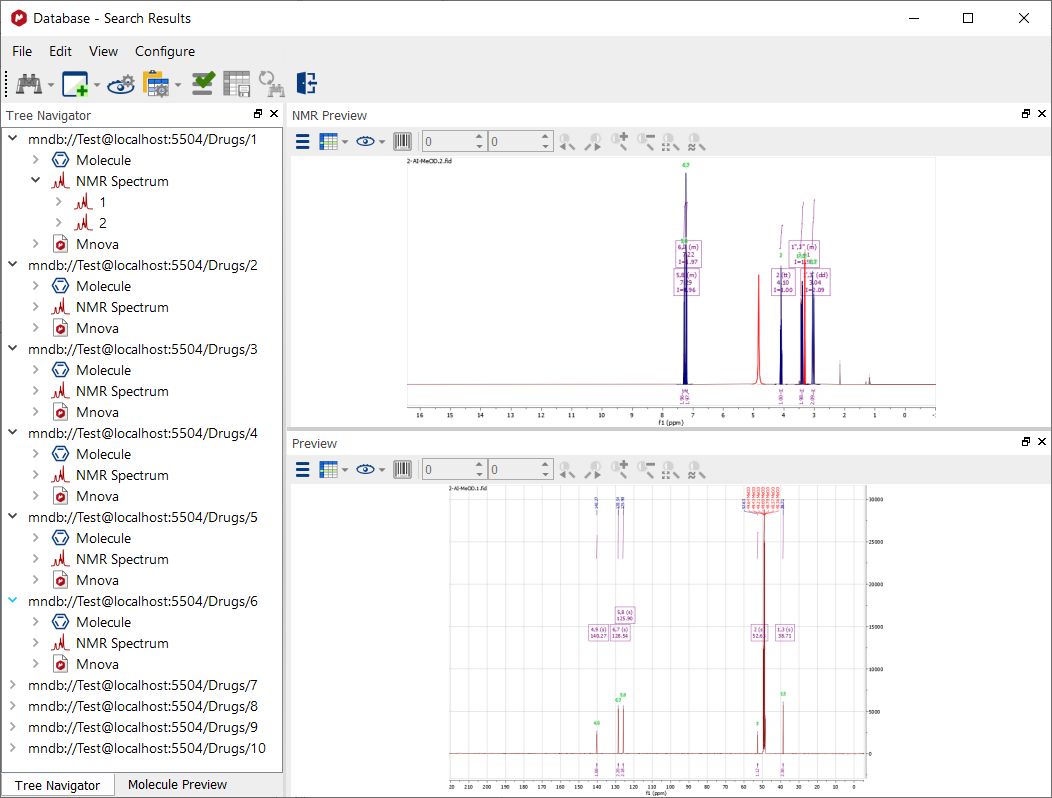
Once you have searched your items in the database, you will get this view by default with the results:
As you can see, you will get the molecular structure, a table with several fields, the query window, spectral views and the item list to change the compound or the spectrum of the preview (just by clicking on the applicable item of the list).
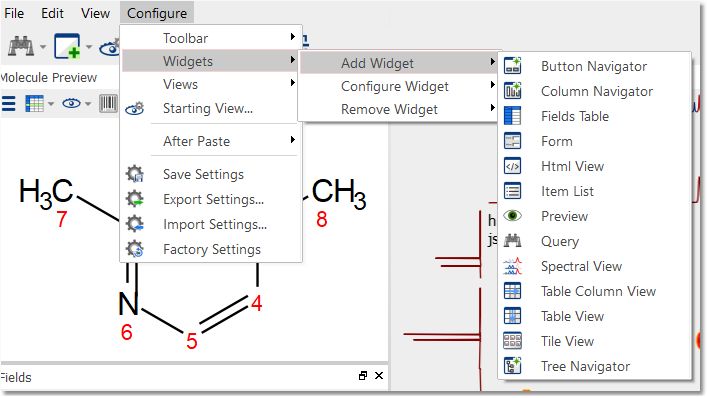
You can add new widgets to the 'Search Results View' by following the menu 'Configure/Widgets/Add Widget'.
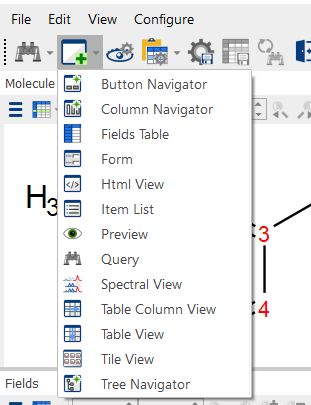
You can also add widgets from the toolbar:
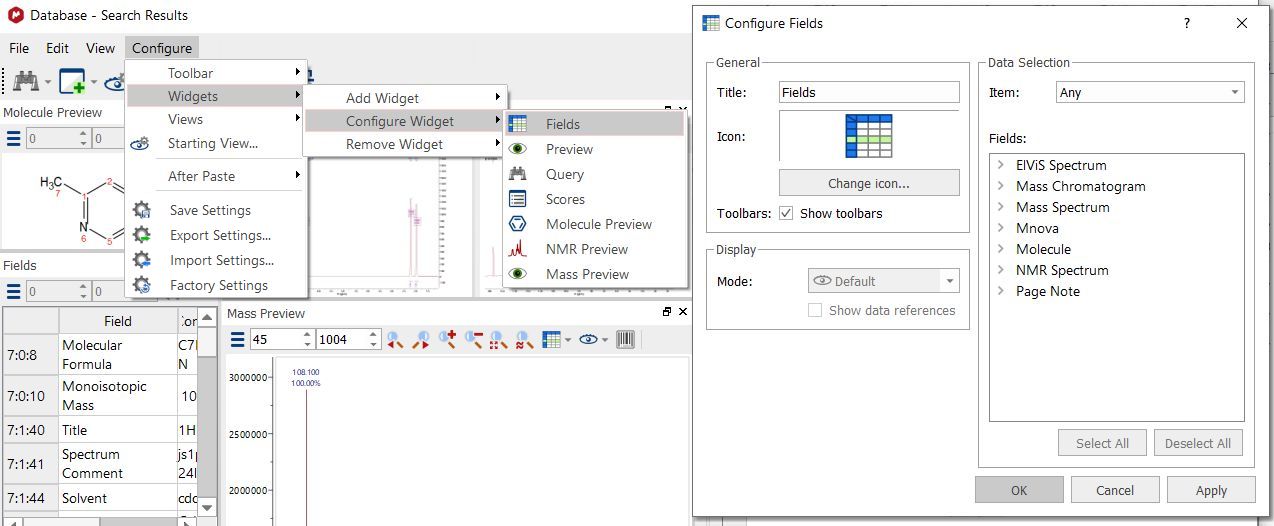
You can select the desired fields to be displayed by clicking on the 'configure button' or by following the menu 'Configure/Configure Widget/Fields' and checking the desired fields from the list:
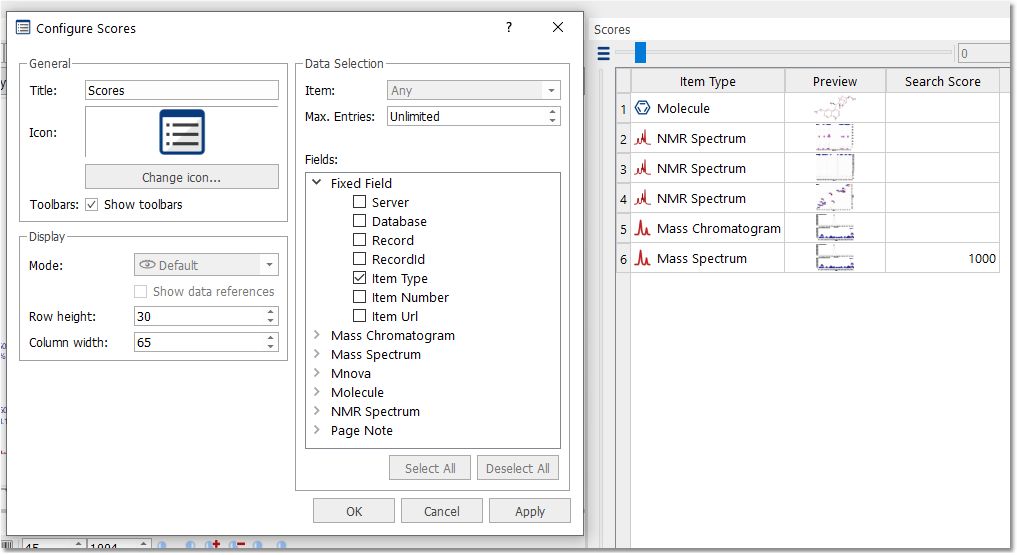
You customize the 'Scores list' to select the maximum number of items that are displayed by record. By default is set "Unlimited" (show all the existing items per record), but you can change it from "Configure Widget\Scores". From here you could also select the desired fields to be displayed on the Score list:
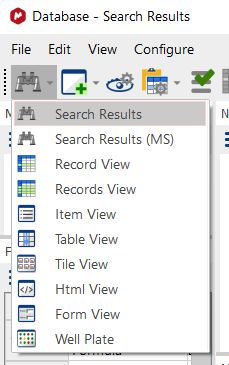
The default template is called 'Search Result', but you will find additional templates by following the 'View' menu (or by clicking on the 'binoculars' scroll down menu):
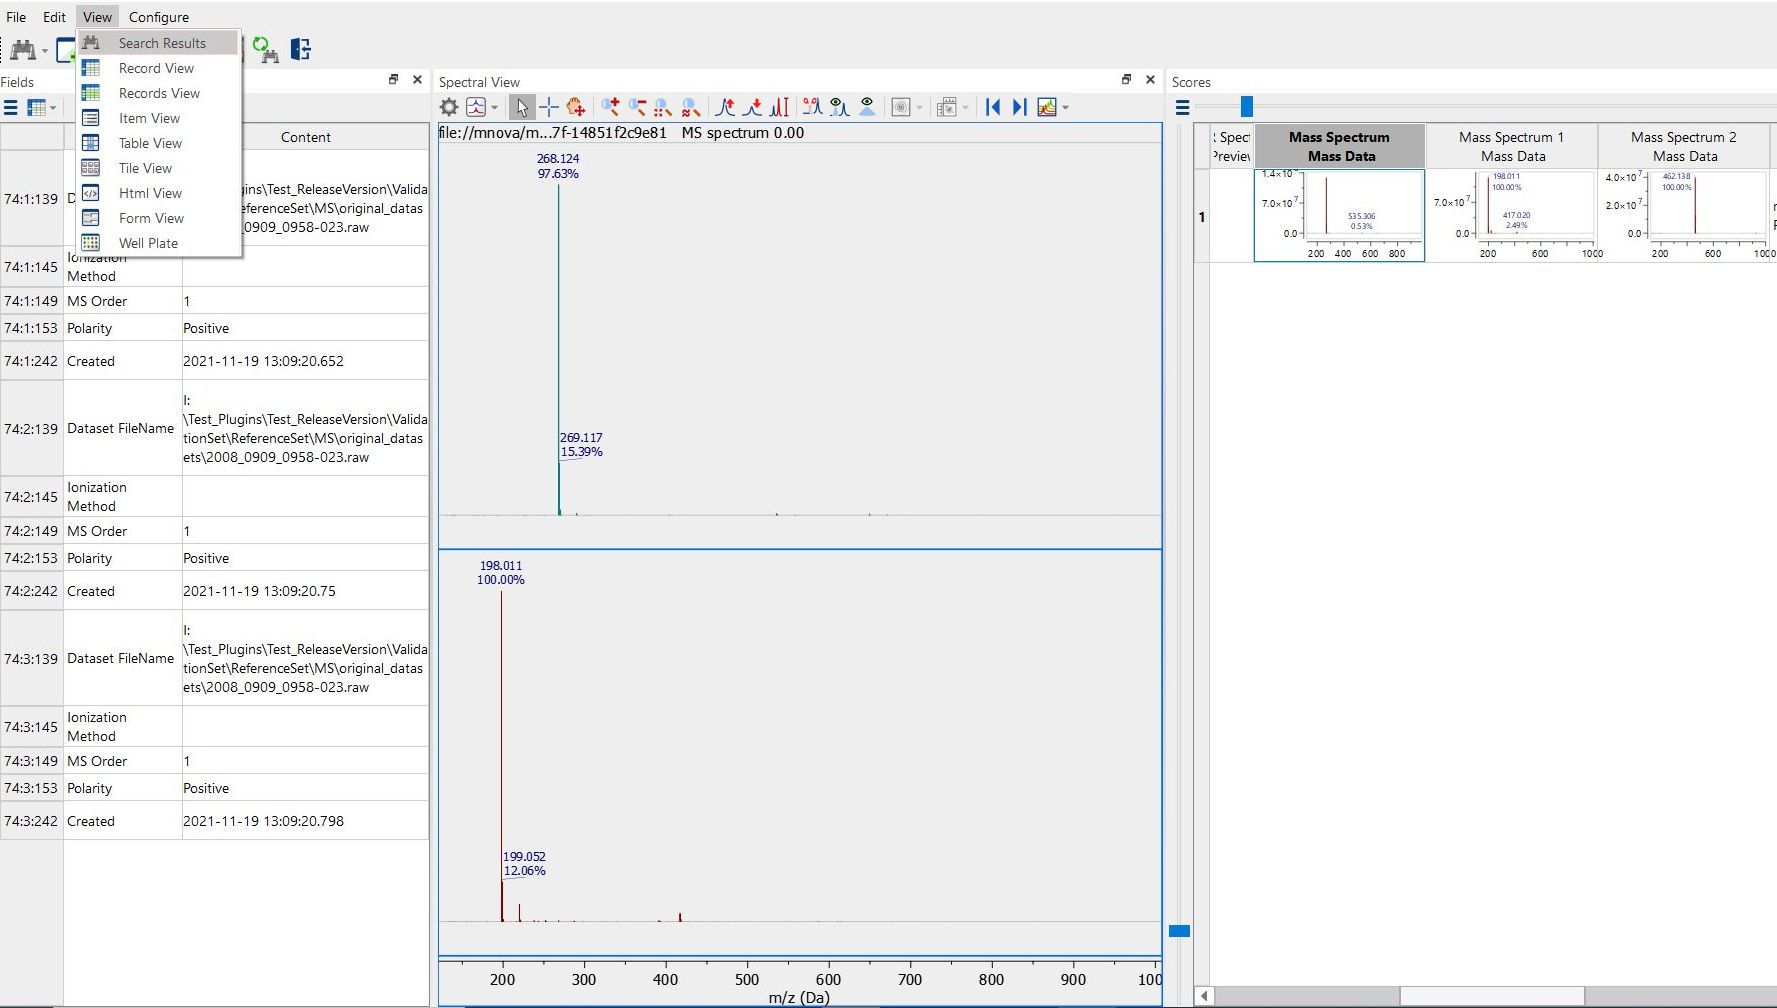
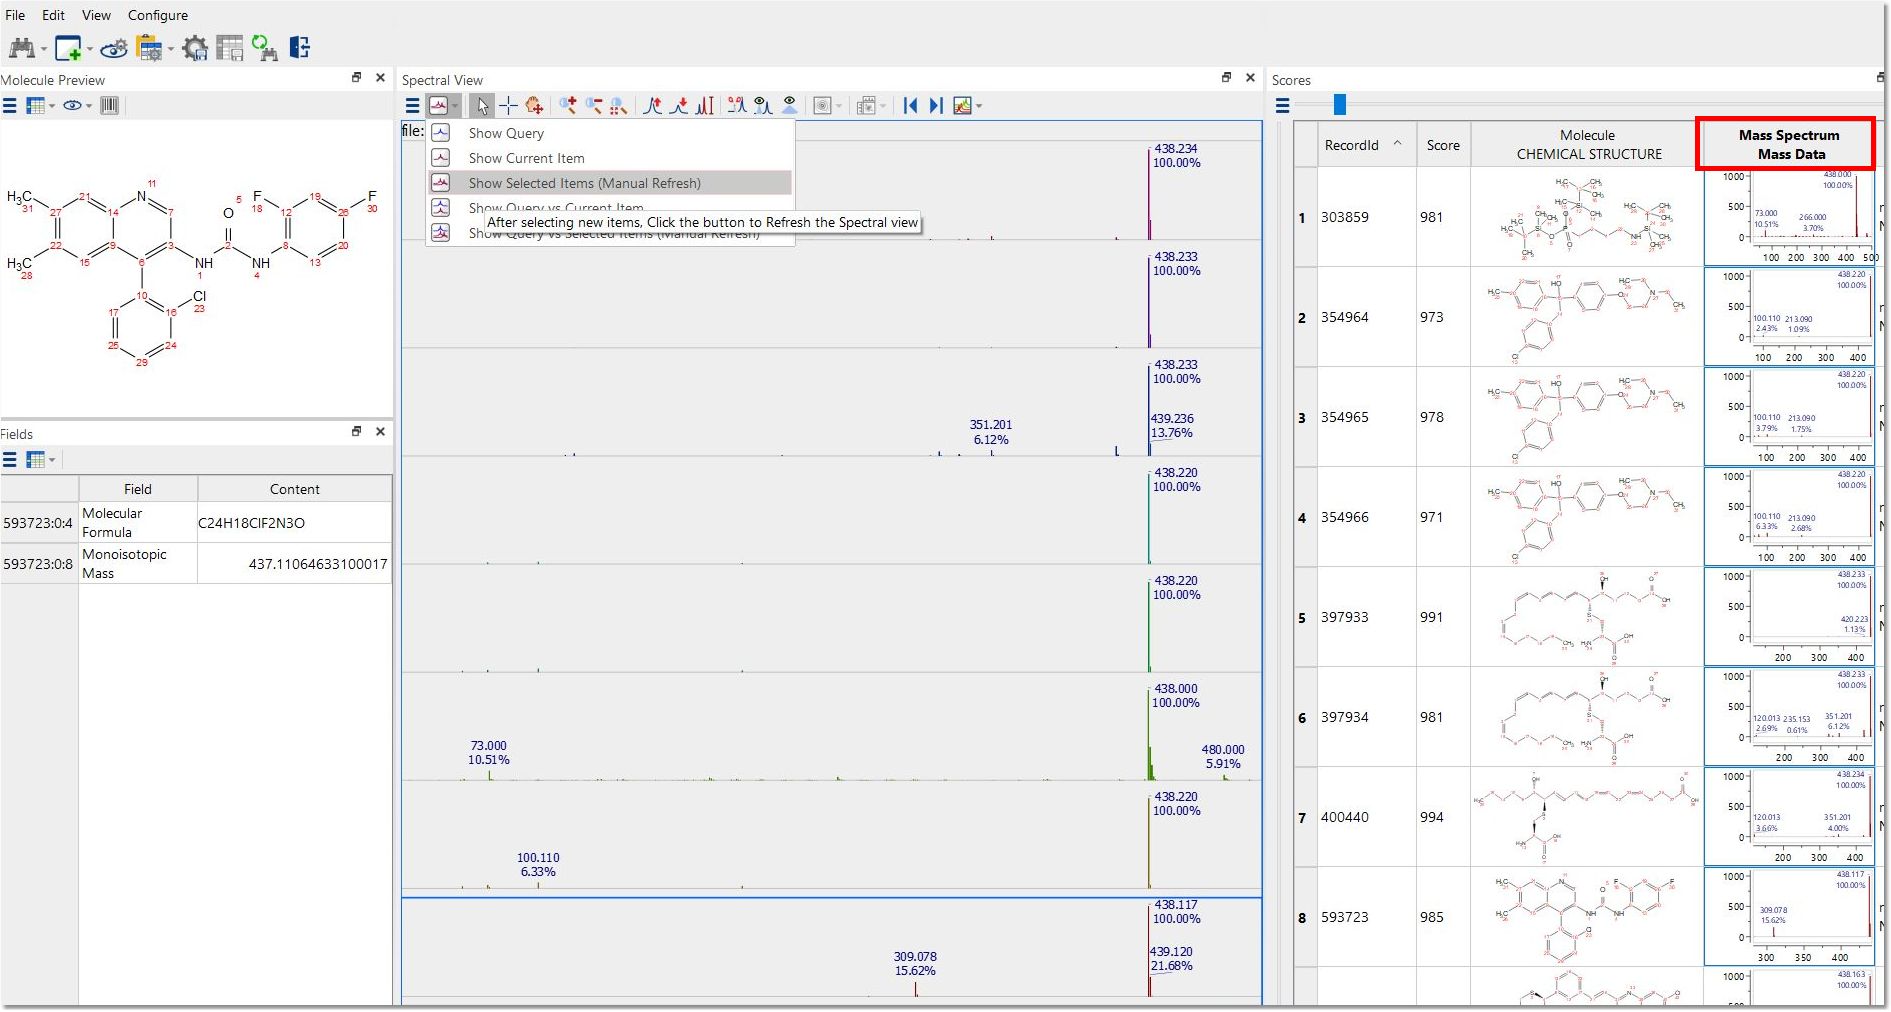
For MS searches, we recommend to use the Search Result view, which will allow you to compare the Query and the Match and easily apply zoom in, zoom out, keep the scale or synchronize the retention time ranges by using the toolbars:
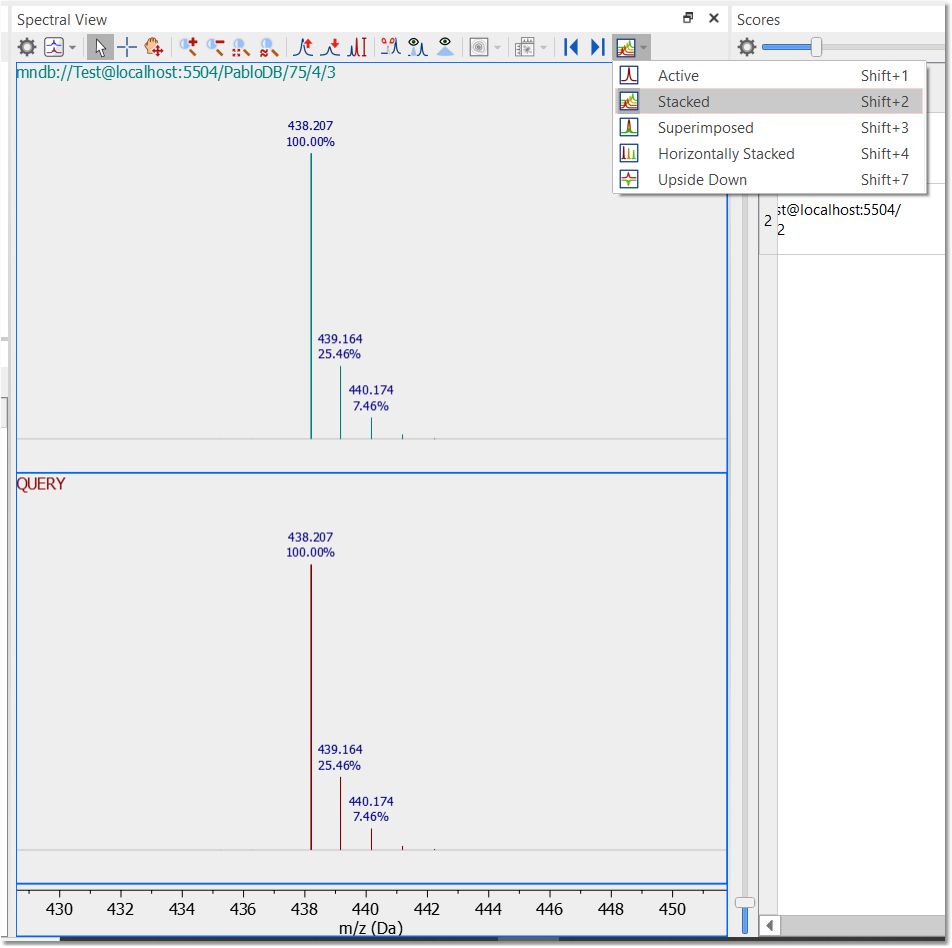
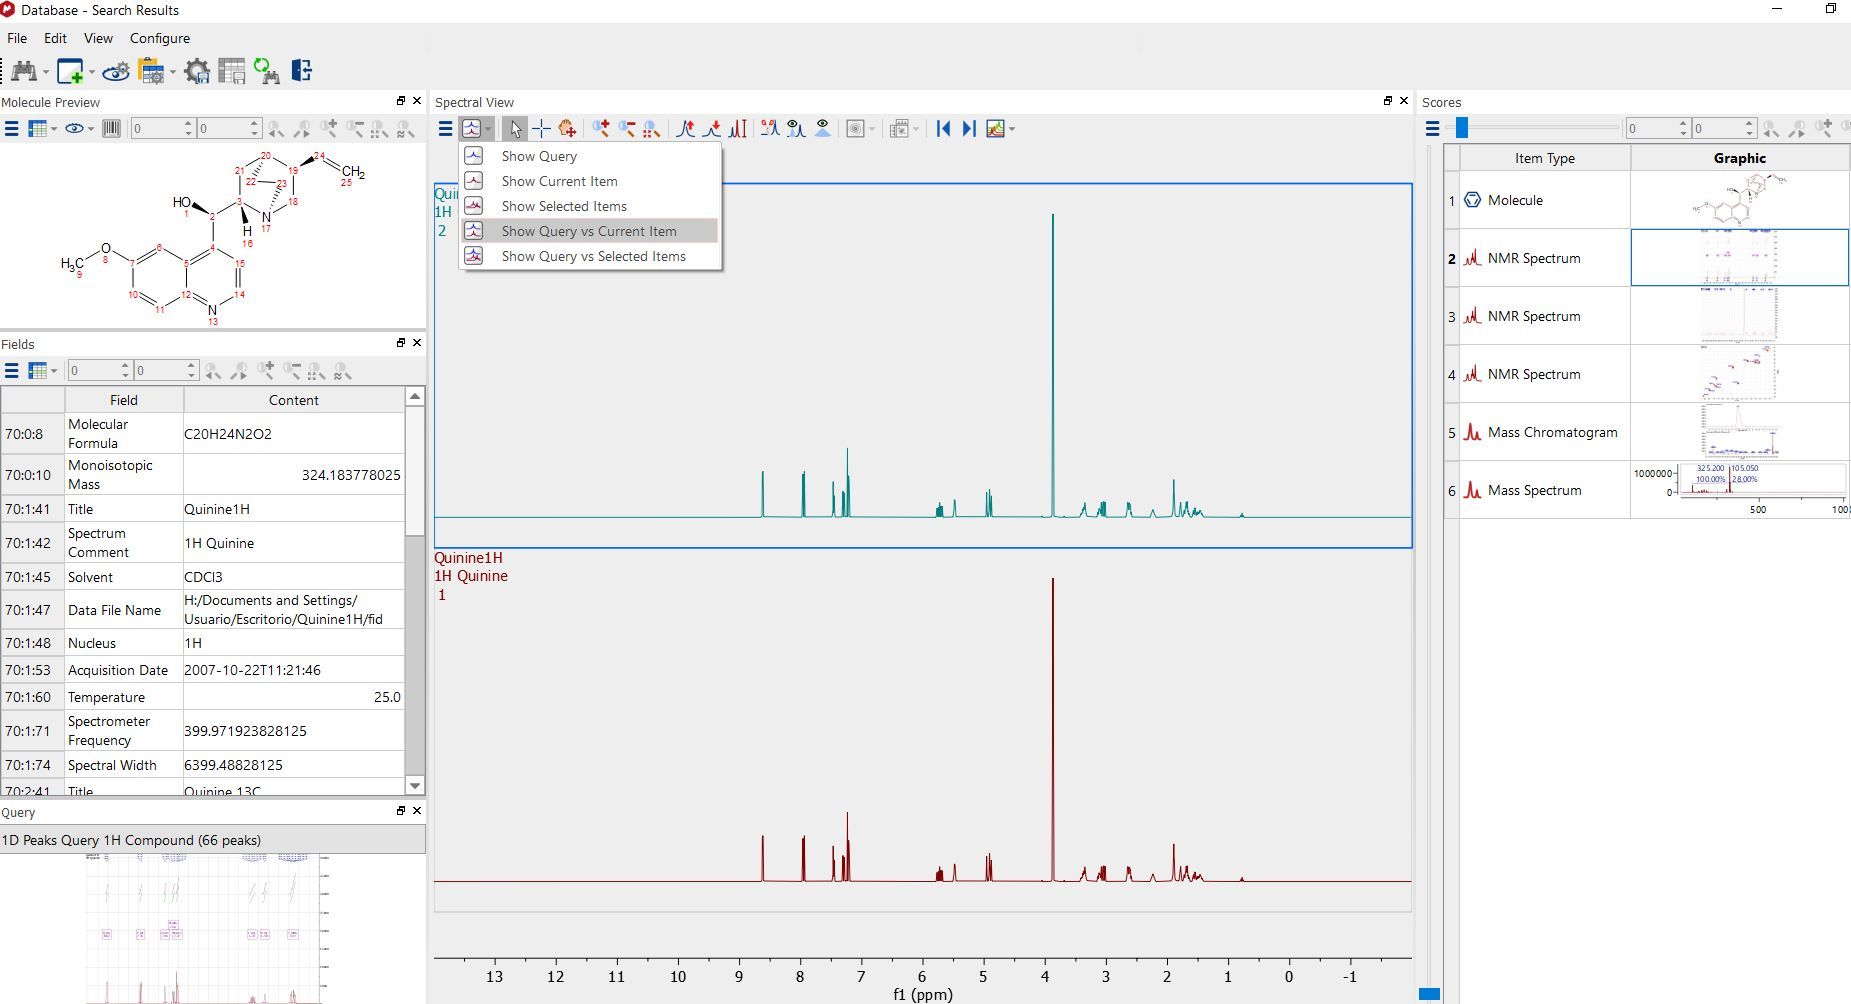
From the spectral viewer, you can also change the view and get the query and the hit in stacked or superimposed modes:
You can also select several previews from the 'Score' widget and stack them with the query by selecting the appropriate option:
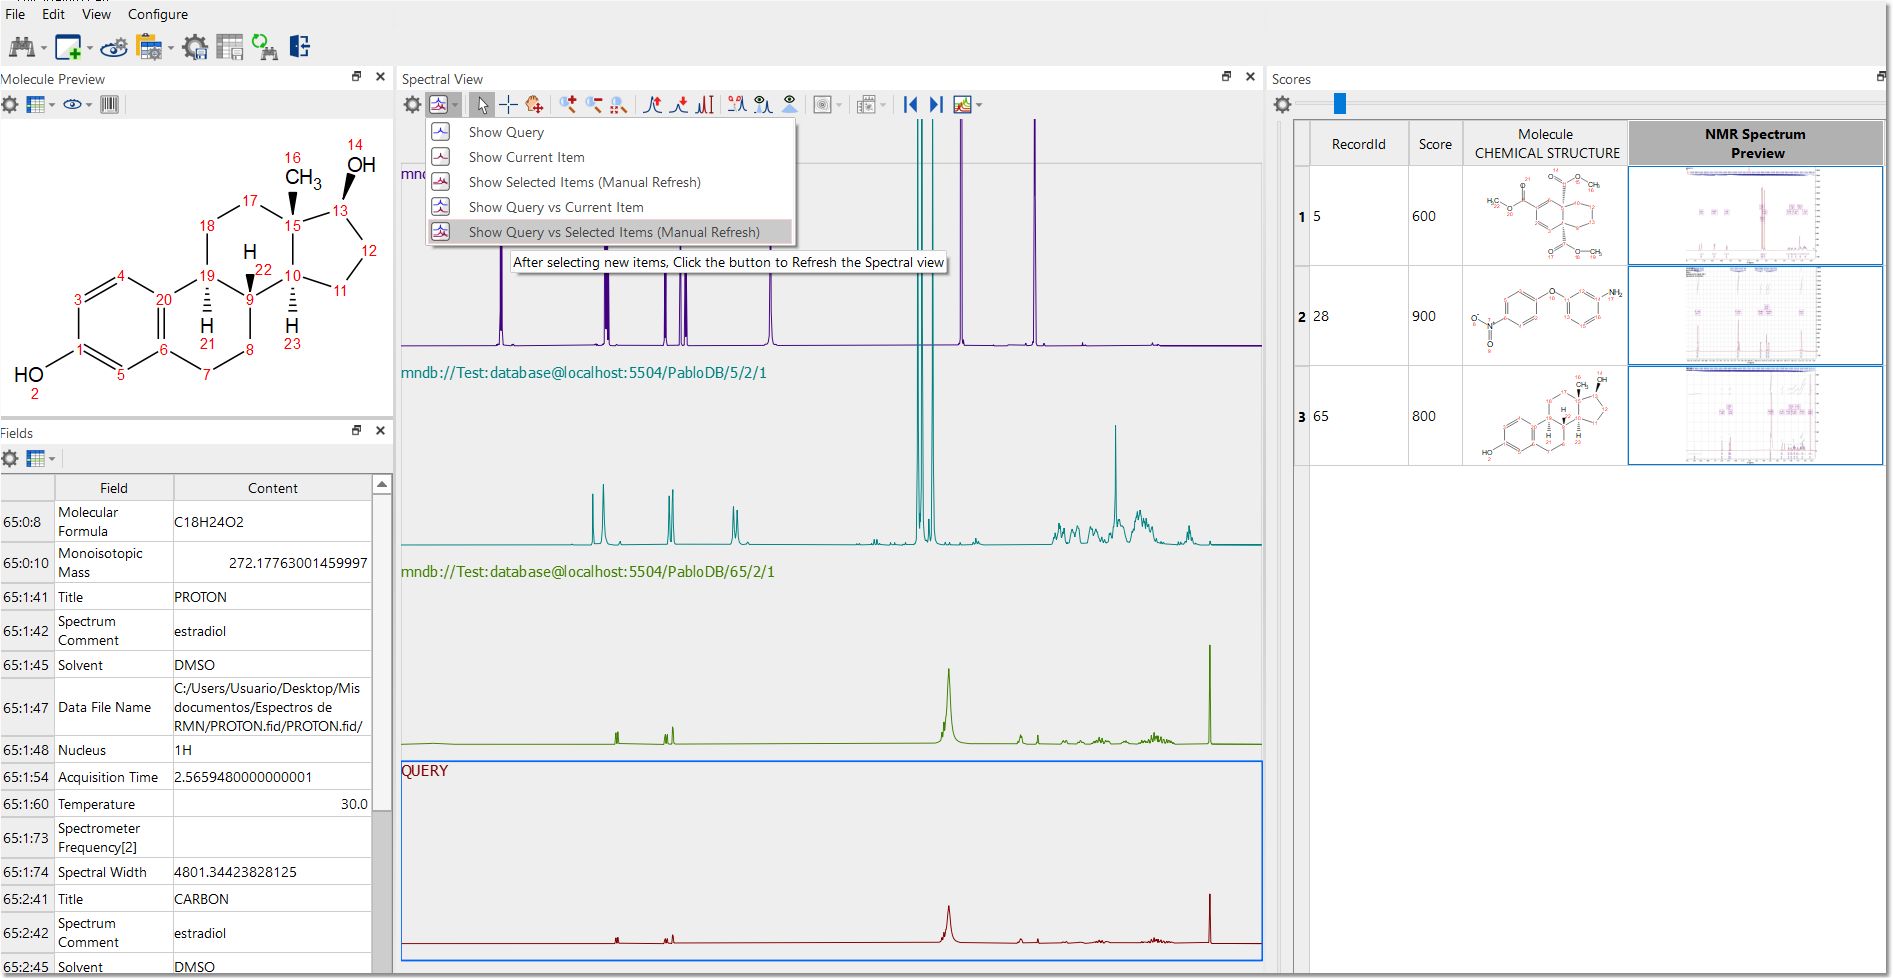
-Show Query: displays an interactive spectrum of the Query, if the query exists. -Show Current Item: shows an interactive spectrum of the current selected item. -Show Selected Items: shows an stacked spectra of all selected items of the same type. -Show Query vs Current Item: shows an stacked spectra of the current selected item and the query . -Show Query vs Selected Item: shows an stacked spectra of all selected items of the same type and the query.
This feature can also be used for chromatograms, NMR and ElViS spectra:
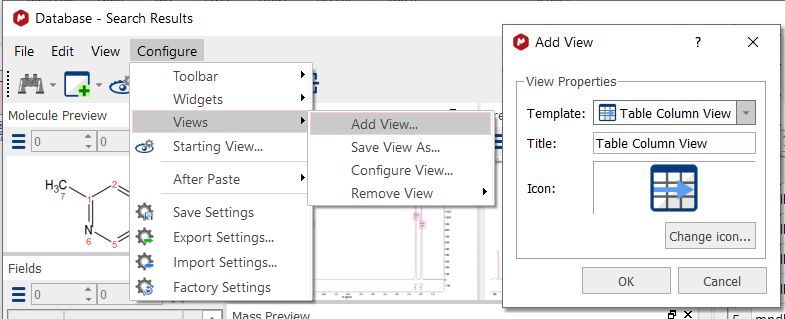
You can create new views by following the menu 'Configure/Views/Add View'
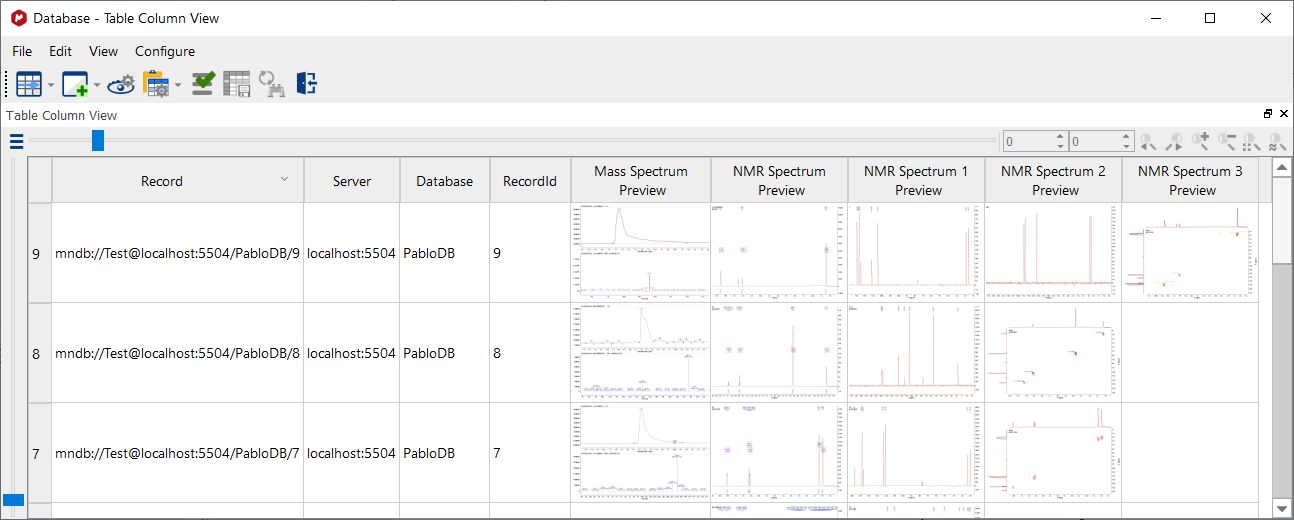
The 'Table Column view' will display only one row per Db Record. The user will be allowed to sort and customize the columns. If a record has several items of the same type, the table will display one column per item (i.e NMR1, NMR2, NMR3, .. MS1, MS2...).
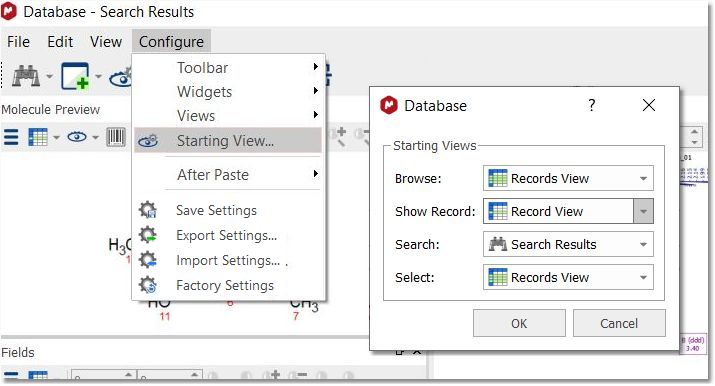
In the same menu (and in the toolbar), you will find an option to select what view template do you want to use to display your results when you are browsing, showing records, searching or selecting:
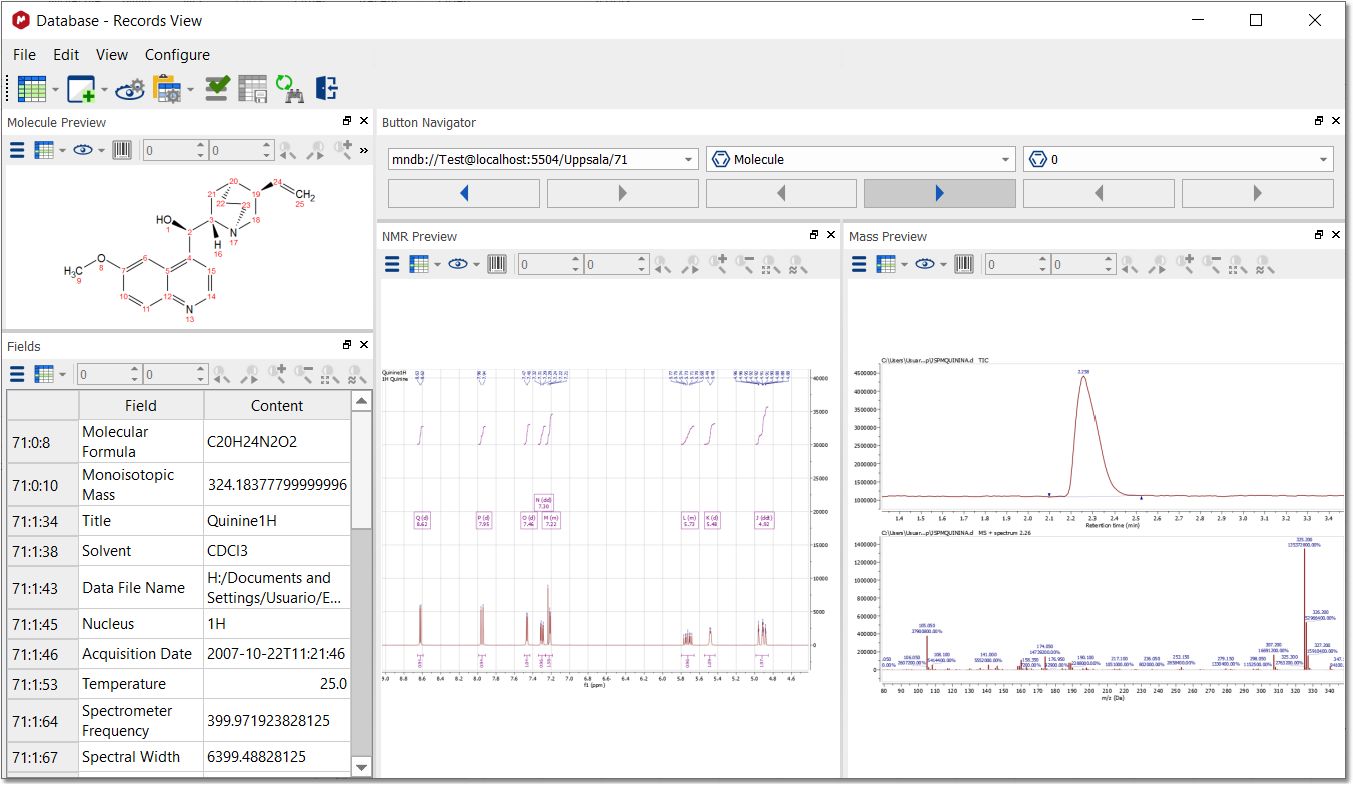
Here you can see for example the 'Records view', with information about molecular structure, a table with several fields, a spectral view and a button navigator to change the compound or the spectrum of the preview.
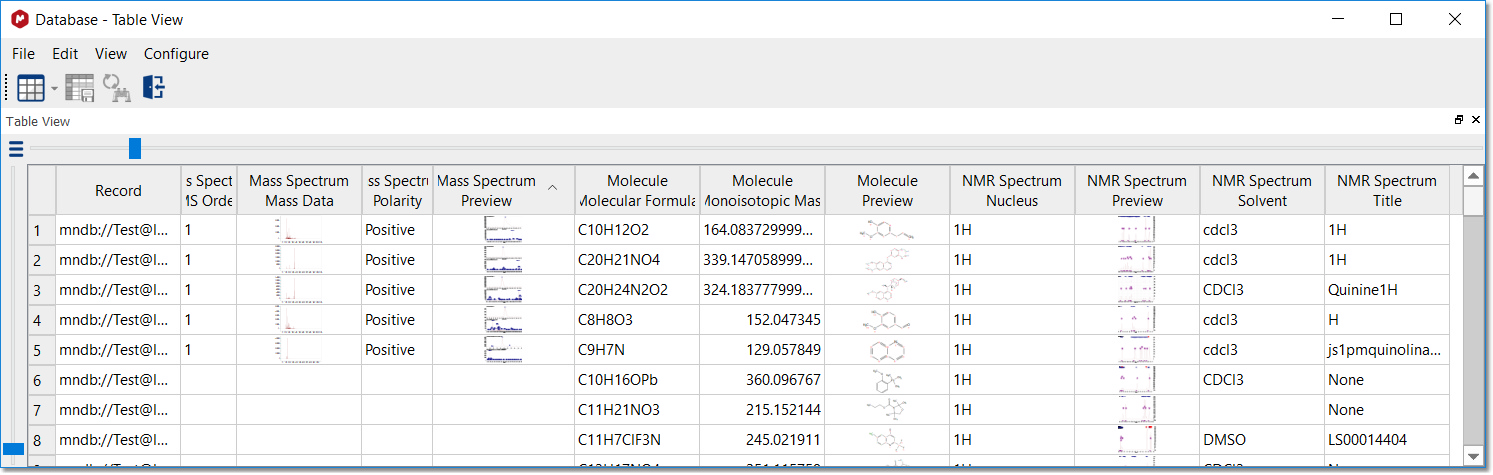
Here you can see the Table view, with information about the compound ID, molecular Formula, Molecular Preview, Title, Solvent, Nucleus, Frequency and Spectrum Preview. You can sort the columns just by clicking and dragging the headers.
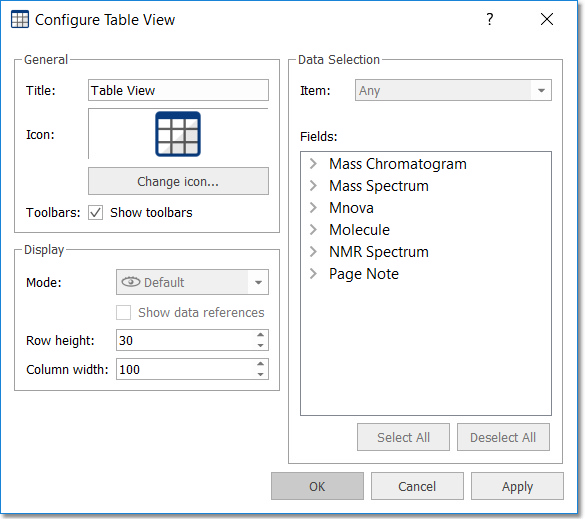
Of course you can add additional information to the table view just by following the menu 'Configure/Configure Widget/Table View' and checking the applicable fields from the list:
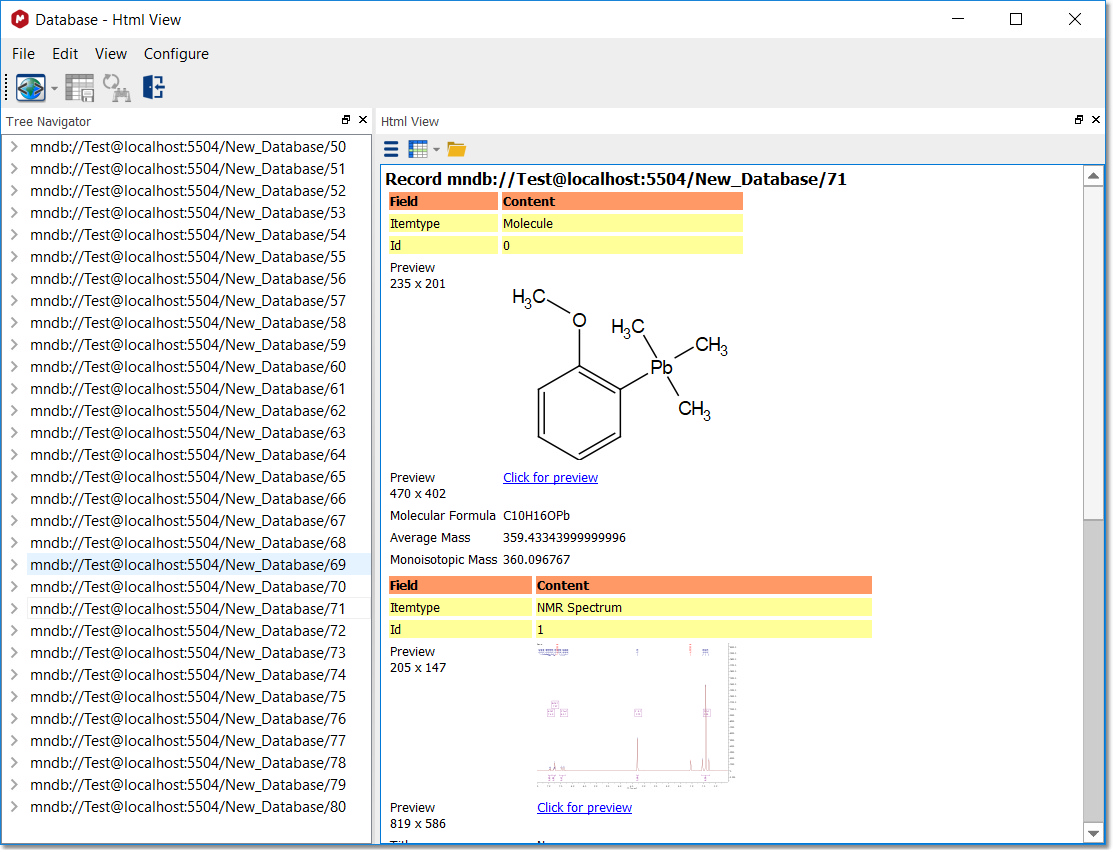
You will find below the HTML view:
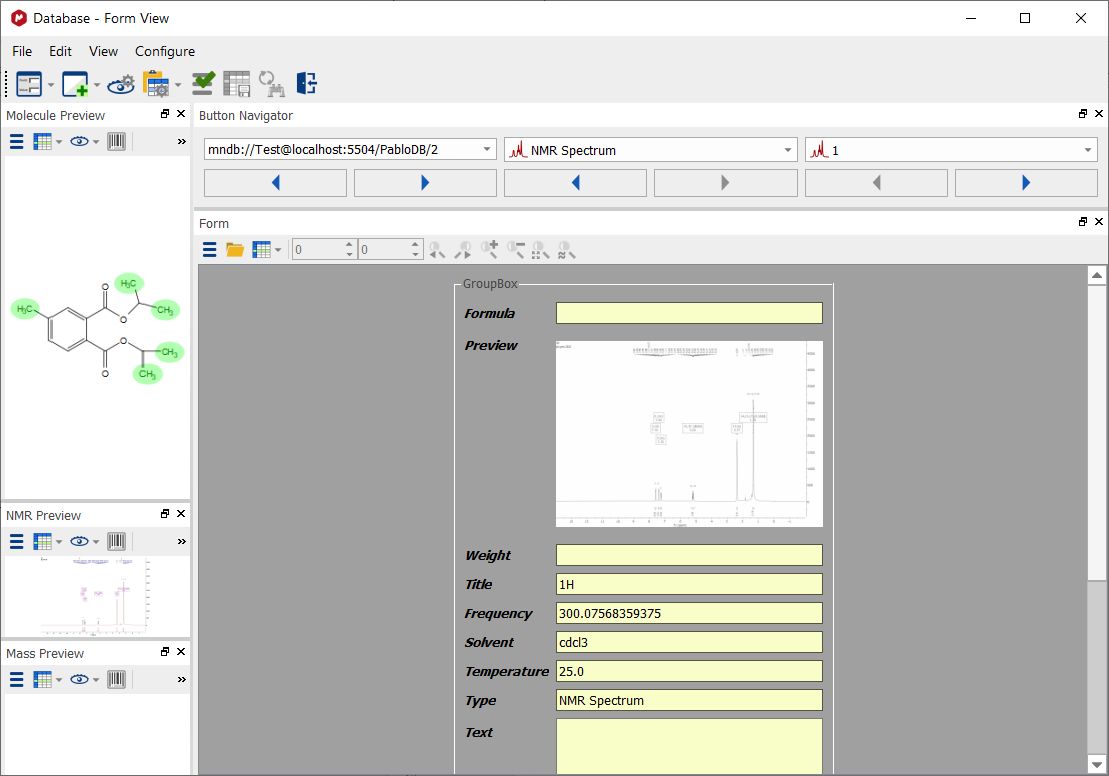
There is also a 'Form View':
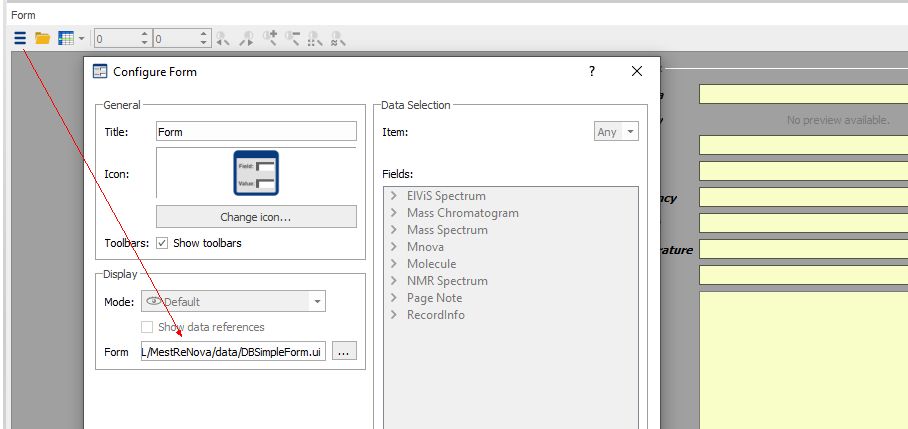
This view can be customized by creating a new.ui file and assign this file as the form layout file in the form widget (from the 'Configure Form' dialog):
Fields, positions, and sizes are specified in the .ui file. DBSimpleForm.ui is provided as an example in the Mnova installations folder.
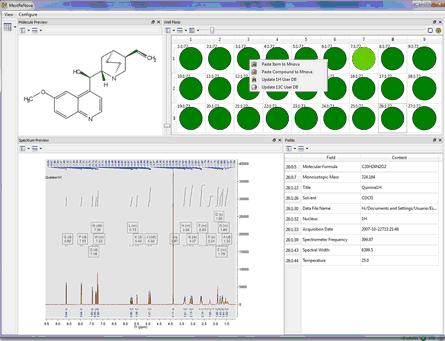
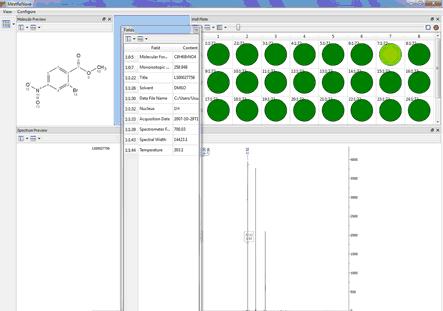
If you have used the Verification plugin to build your database, then you will find useful the 'Well Plate View' which will contain information about the Verification results (by using the typical color code for the plates; green for a good verification result, yellow for a doubt and the red for a bad result in the verification).
Clicking on any of the plates, will show the corresponding molecule, spectrum and table of fields. Double clicking on the plate will copy all the information to Mnova as a new document. Right clicking on the well plate (or on several) will allow you to 'Paste the item(s) or the compound(s) to Mnova' or to 'Update the 1H or 13C Prediction Database':
You will be able to freely customize any of the templates or even create your own ones. All the objects are linkable and the user will be able to change its position by just clicking&dragging. In the example below, we are changing the location of the 'Fields' table:
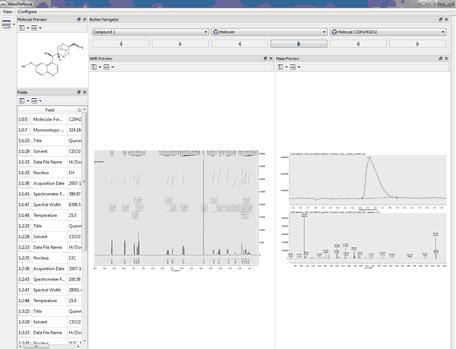
In the example below, we are showing a template with 1H and MS datasets.
To create it, we have used the default 'Record View' template and added the MS preview by following the menu 'Configure/Add Widgets/Preview'. Once the new 'Preview' has been created, we have selected 'Mass Spectrum/Preview' after having clicked on 'Configure' button.
In addition the user will be able to customize the 'Views' by adding/changing information of the 'Previews' or 'Tables' boxes.
From the Configure menu, the user will be able to add, configure and remove widgets (such as 'button, column or tree' navigators, Fields Tables, Previews, etc...).
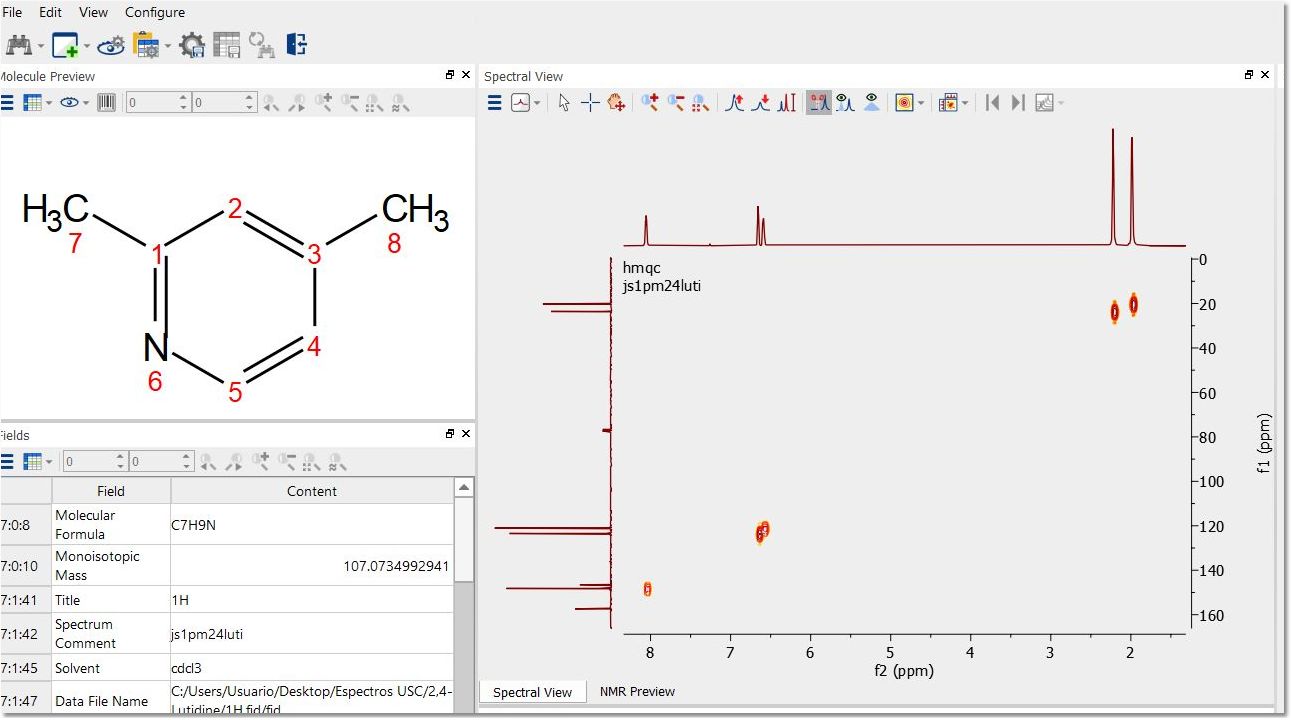
The 'Spectral View' widget will be very useful to interact with your 1D, 2D and stacked NMR spectra. You will be able to use the crosshair, pan, zoom, intensity, cuts, show 2D traces, etc:
The Tree Navigator could be really useful to view all the records in a shot:
If you want to show the original spectrum or molecule that you used for the search, you will need to add the 'Query' widget and you will be able to compare the query spectrum with the hits from the database.
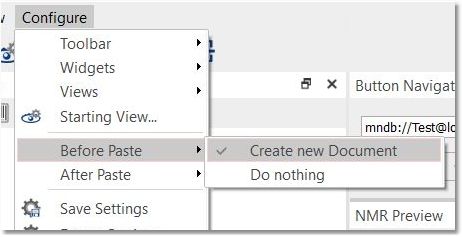
The 'Before Paste' option will allow you to create a new document in Mnova before pasting an item or a record into Mnova:
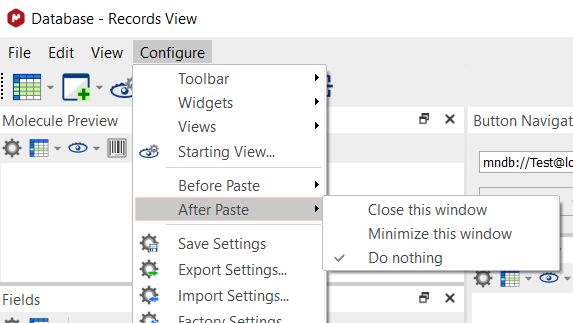
The 'After Paste' scroll down menu will allow you to decide if you want to close or minimize the DB Browser after having pasted an item or a record to Mnova.
From the Configure menu, you can also Add//Configure or remove views or to load/save the settings of your templates. |