Searching in the Database


Searching in the Database |
|
|
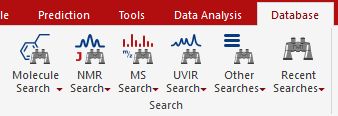
You can use the applicable commands to search 'structures', 'substructures', 'formulas', 'peaks', 'multiplets', 'Massitems', 'numbers', 'texts', etc':
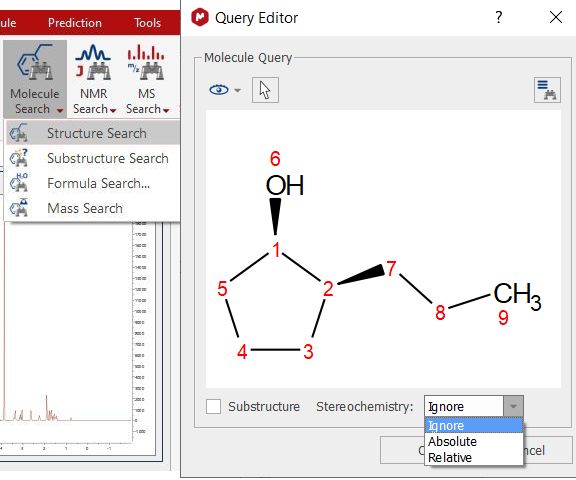
Structure Search You can search for any molecular structure in the database by selecting 'Structure Search' (which will display the Query Editor). Click on OK to run the search.
From here, you will be able to run also Substructure searches just by checking the applicable box.
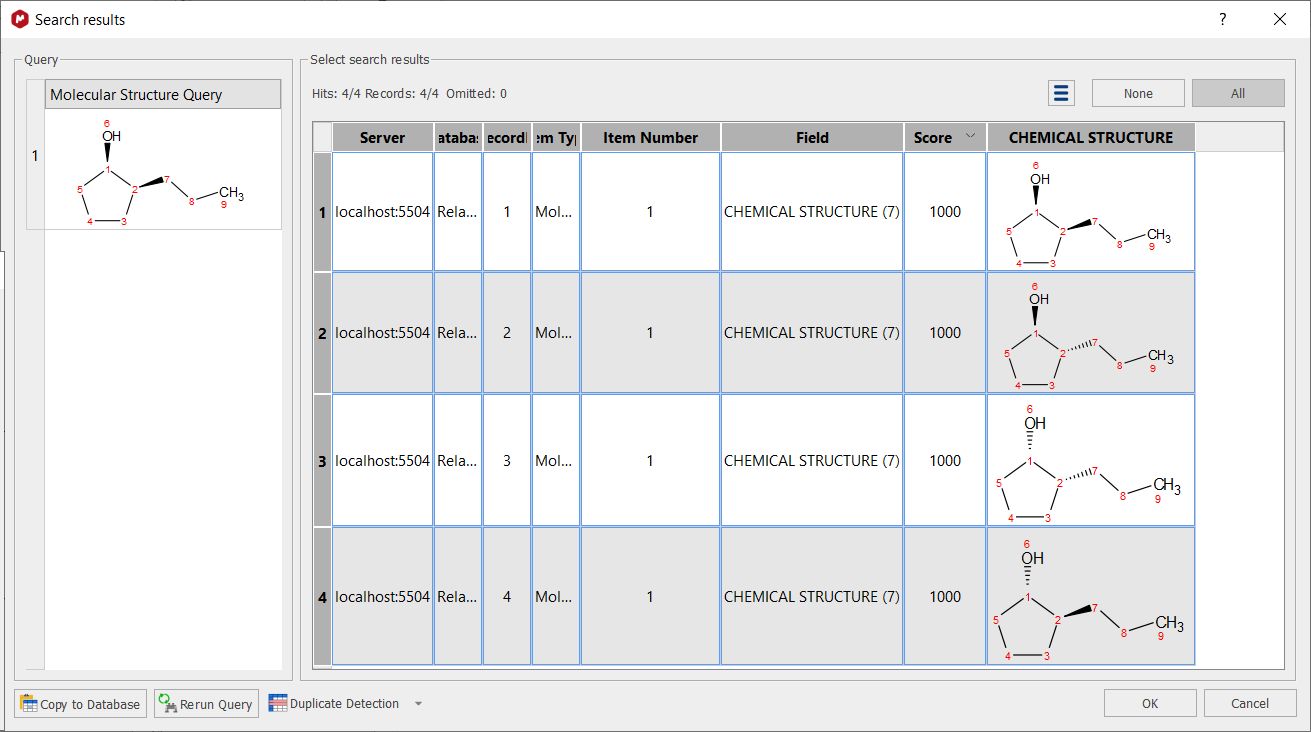
Selecting ignore from the StereoChemistry scoll down menu will not take into account the stereobonds for the search. Imagine a database with 4 compounds RR, RS, SR and SS, if you search for one of the 4 compounds (i.e. RS), you will get 4 hits:
Selecting 'Absolute' will take into account all the stereocenters present in the structure (so if you search for a molecule with a RS configuration, the hit will be only the molecule RS).
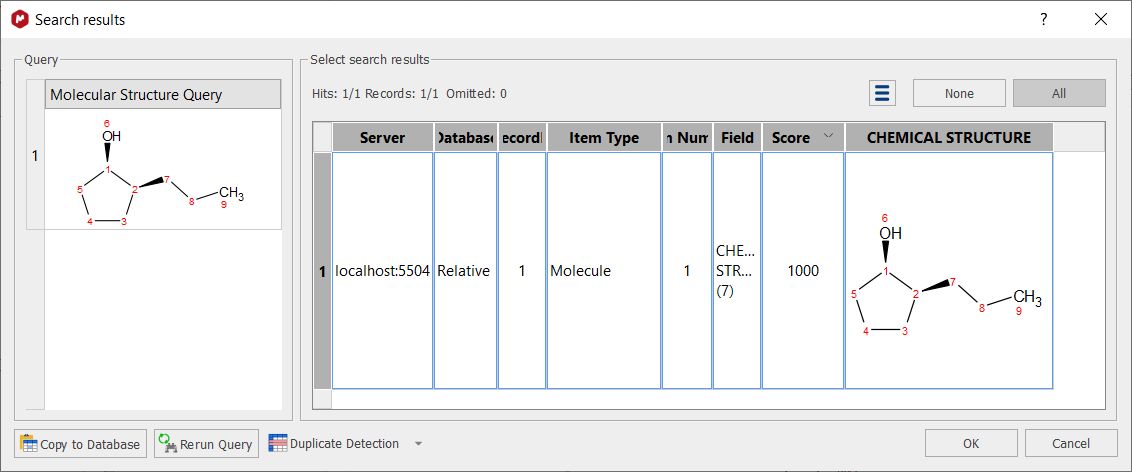
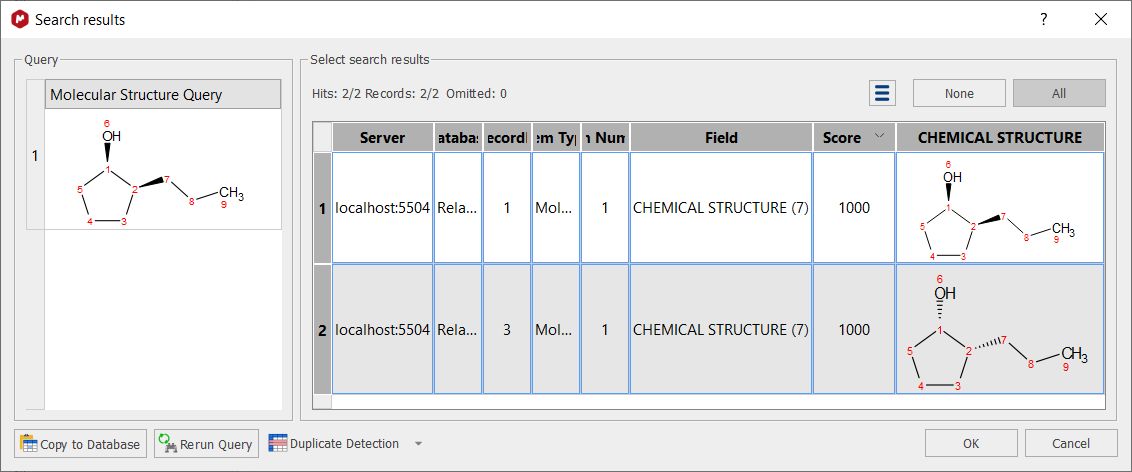
Whilst selecting 'Relative' will only take into account the relative stereochemistry, that's it; if you search for a molecule with a RS configuration, the molecules RS and SR will be hits:
Clicking on the 'Convert to advance query' button will allow you to convert it to an advanced search so that you can add new queries and combine them.
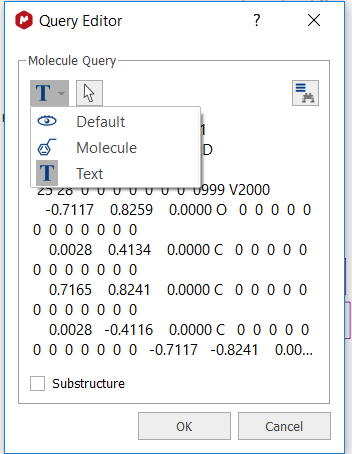
You can also see the mol file as plain text, by selecting the applicable option in the 'Select Display Mode' scroll down menu:
This button
After having clicked on OK, Mnova will search for the molecule in the database.
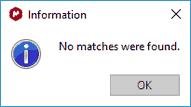
•If the molecule is not in the database you will obtain this message:
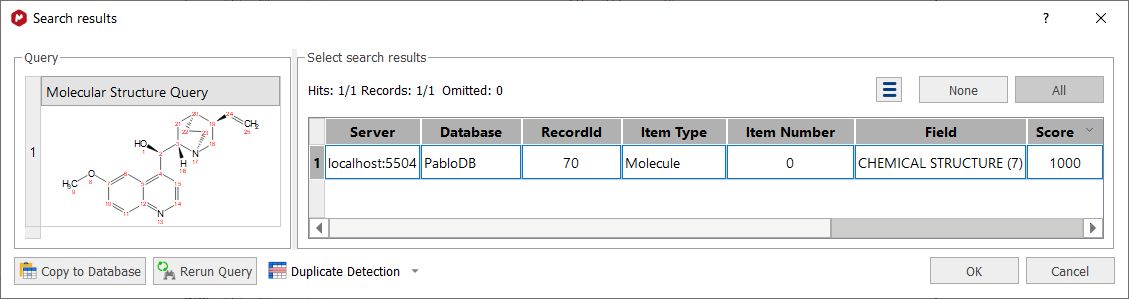
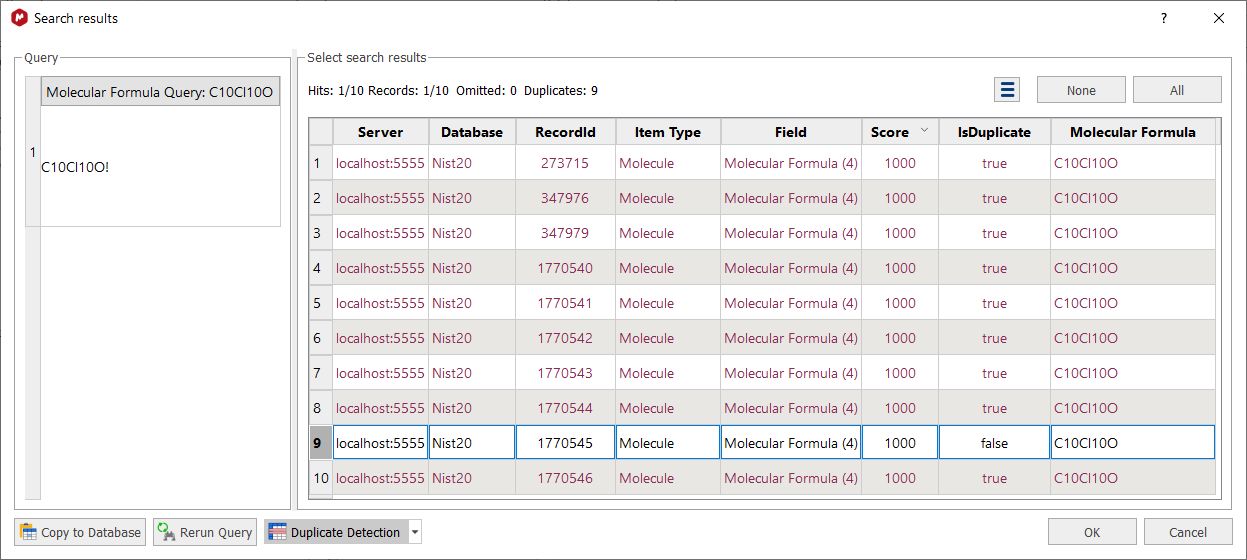
•If the molecule structure is stored in your database, Mnova will show you the information which appears in the database about this compound. For example, imagine that you load the molecule structure of the quinine and you select 'Structure Search'. In that case, you will obtain a window like this one (with a Match Score of 1000 which is the maximum value):
Note: Clicking on the Copy to database button, will allow you to copy the result to another database. Clicking on the 'Rerun Query' button will allow you to refine your search.
Clicking on the Duplicate selection button, will highlight the duplicated results (in the case that you have them).
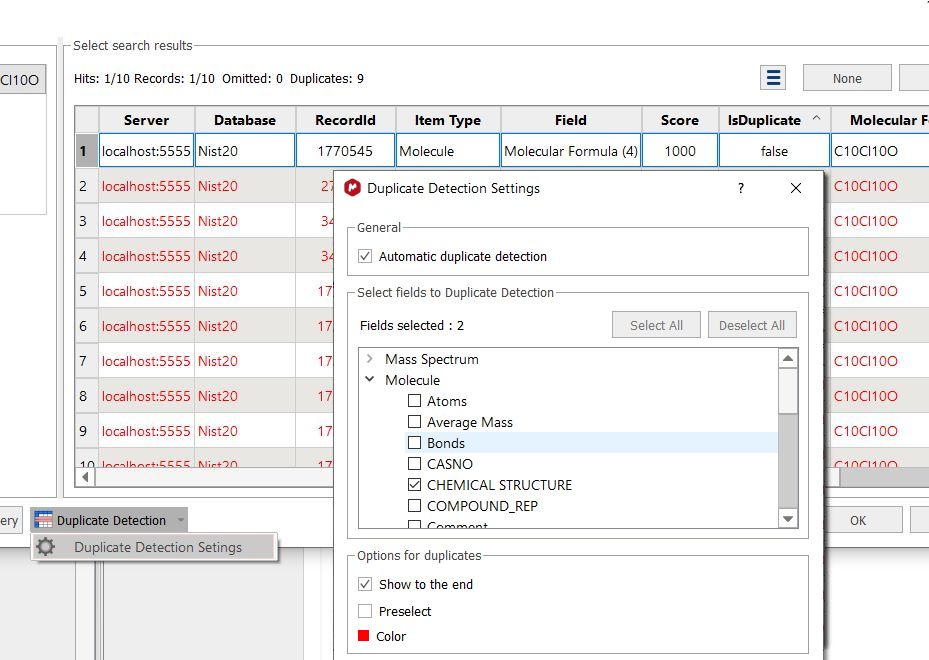
You can customize the settings for the duplicate detection feature by selecting the appropriate option from the scroll down menu. By default Mnova detects duplicates using the "Molecular Formula" field, but you could use any other combination of fields:
Clicking on this button
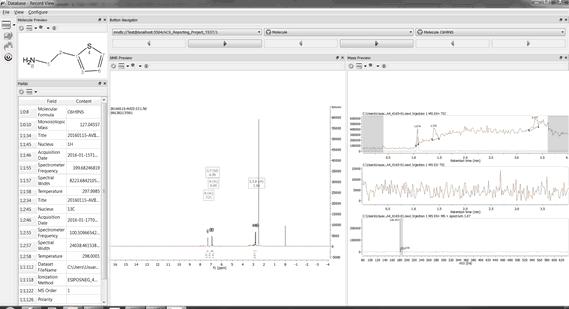
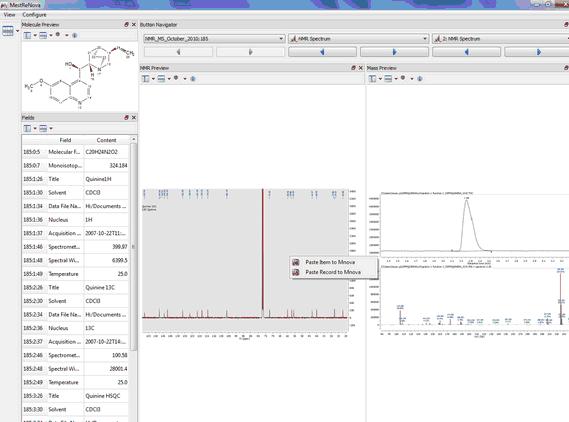
Click on OK to get a window like this one:
Please bear in mind that you can also check any other spectrum (such as a 13C NMR) if we have previously added to the database, just by clicking on the 'blue arrow' (highlighted in red in the picture above):
You can also copy the spectra or the molecules to a Mnova document just by double clicking on it (or by right clicking and selecting 'Paste Record or Item to Mnova').
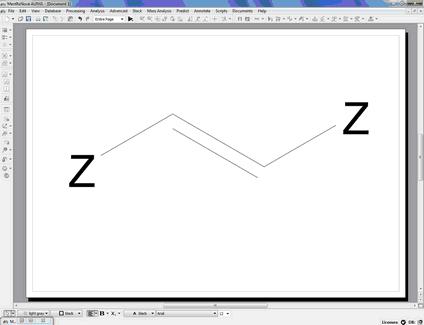
You can also use generic atoms like R (any chain, except H, D and T), Z (any chain; including H, D and T), A (any atom, except H, D, T), X (any halogen), Ht (any heteroatom) in the molecular structures. For example, to search for alcohols or amines, draw the corresponding group (and anything else you want the results to contain), add Zs (Z-NH2, Z-OH), and do a structure search.
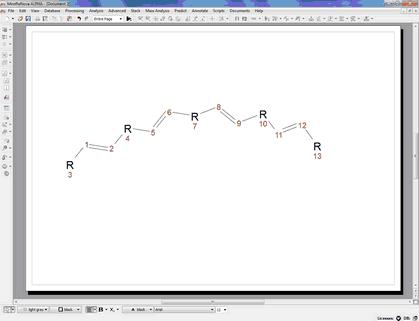
Here you can see an example to find compounds containing C=C double bonds:
If you want for example to find compounds with at least four C=C double bonds, you can draw this:
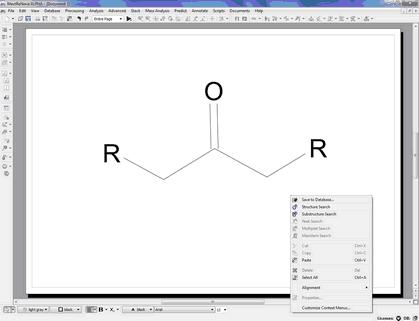
If you wan to search for ketones, you can draw this molecular structure:
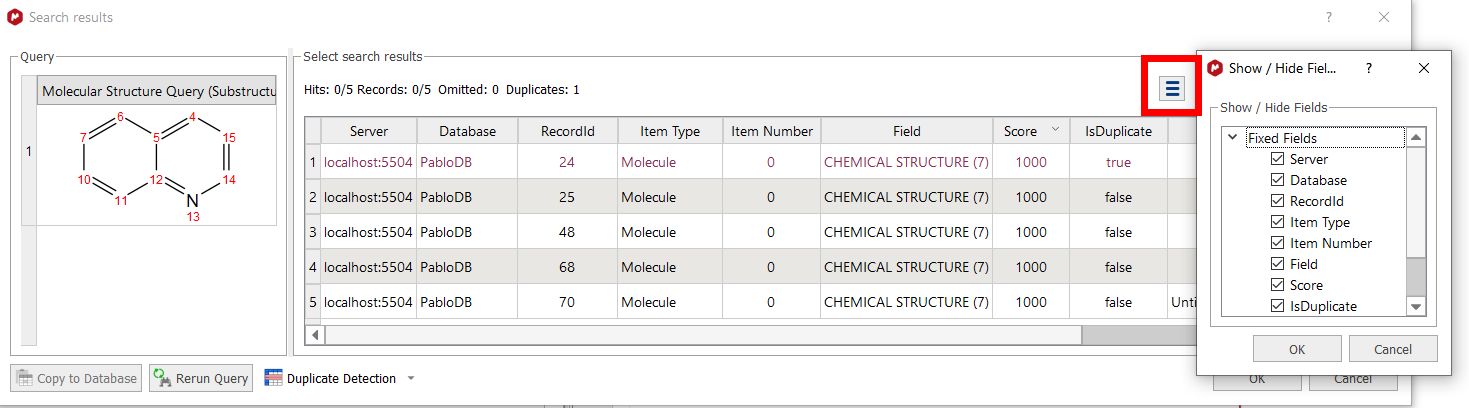
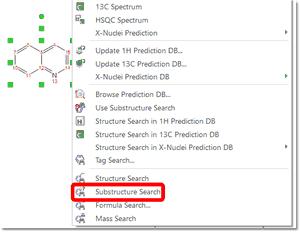
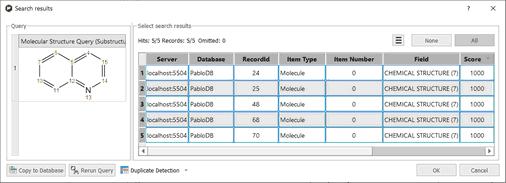
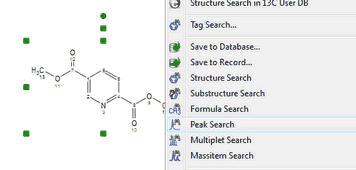
Substructure Search The SubStructure Search feature is used to locate products by chemical structure. Simply copy a structure fragment, right click on it and select 'Substructure Search':
In that case we obtained 5 hits (for the records 24, 25, 48, 68 and 70):
You can also use generic atoms like R (any chain, except H, D and T) ,Z (any chain; including H, D and T) ,A (any atom, except H, D, T) ,X (any halogen) ,Ht (any heteroatom) in the molecular structures. For example, to search for alcohols or amines, draw the corresponding group (and anything else you want the results to contain), add Zs (Z-NH2, Z-OH), and do a substructure search.
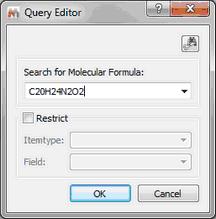
Formula Search This feature will allow you to search for any specific molecular formula of your database. To do that, just type the molecular formula in the 'edit box' and click on OK. You can restrict (it is not mandatory) the search by using the 'ItemType' and 'Field' options:
The format for a molecular formula search is quite flexible. It can be explained with some examples:
•If you type: C1,4 H3,8 N1,1; the program will search for molecular structures with 1 to 4 carbons, 3 to 8 H and exactly one N; other elements are allowed but not necessary. Note that spaces can be omitted.
•Elements can be in lower case, as long as there are not 2 without space, so “c1,4h3,8n1,1” would be OK, whereas “c4,7no” is not, since “no” will be interpreted as “No”.
•Ranges can be omitted, so “C” is the same as “C1,1”, “C3” is the same as “C3,3”, “C,4” is the same as “C1,4” and “C2,” is the same as “C2,∞”
•The meta symbol “HT” can be used for hetero atoms, “X” for halogens, and “!” (exclamation mark) at the end of the formula to only allow specified elements. Thus, “C1,4 Ht3” searches for 1 to 4 carbons and exactly 3 hetero atoms, whereas “C3,5 H6,10!” would search for hydrocarbons with 3 to 5 C and 6 to 10 H.
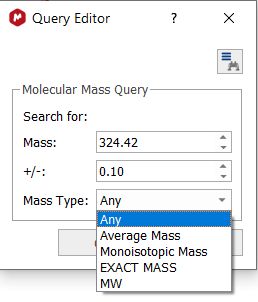
Mass Search This feature will allow you to search in the Database (by using the Cosine method) for the Mass value of your molecular formula, with the capability to select a range and also the Mass Type (Average, monoisotopic, exact mass or Molecular weight)
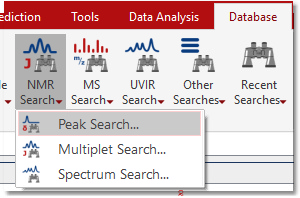
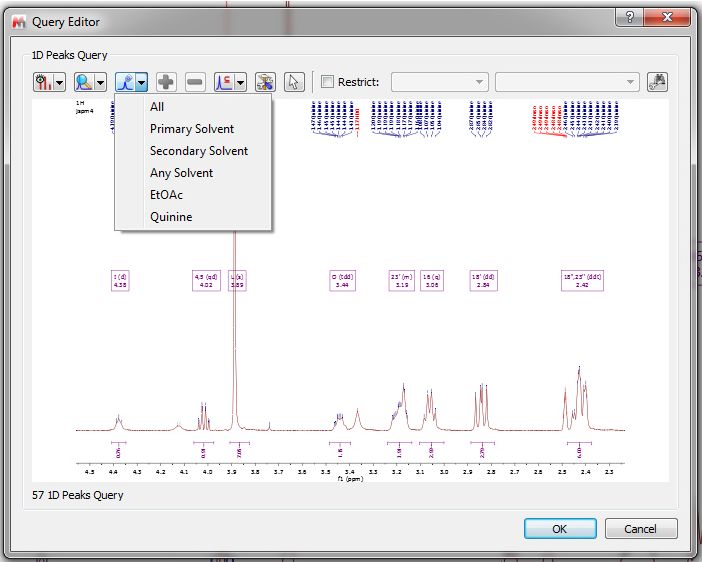
Peak Search If you have a spectrum loaded in Mnova (this is not mandatory) and you select 'Database/NMR Search/Peak Search' (or right click/Peak Search'), the application will look for these peaks in the database. If you have expanded any area of the spectrum, it will only look for the peaks of the expanded area (and not for the whole spectrum). Please bear in mind that if you have forgotten to apply the Peak Picking to the expanded area, Mnova will do it (by using the automatic Peak Picking).
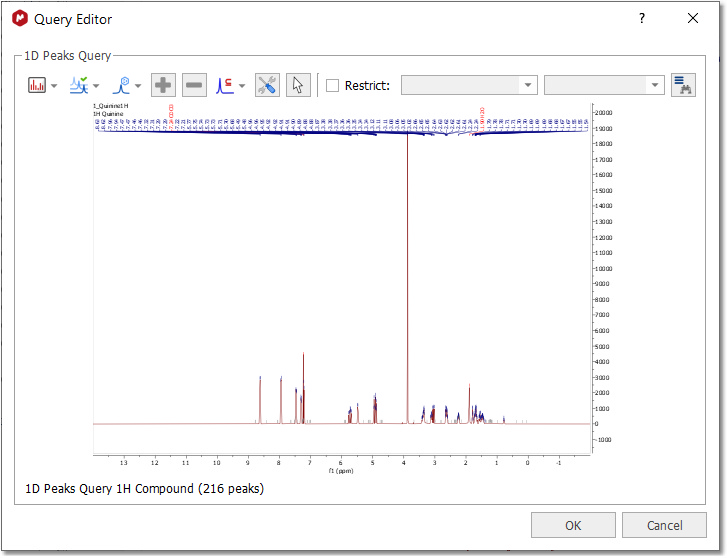
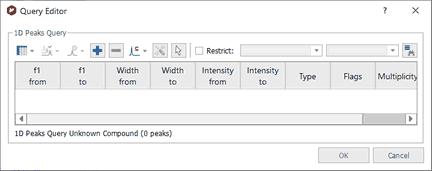
After having selected the Peak Search feature, the Query Editor dialog box will be displayed:
Clicking on the 'Convert to advance query' button
In the dialog box above, you will find a toolbar with different buttons:
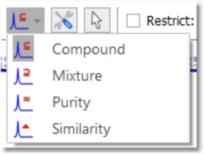
•Select Display Mode: it will allow you to show the peaks table or the spectrum preview •Peaks: to show 'Full Range' or only 'Visible Range' of the expanded region •Select Peaks by Compound: to search only for some specific compound peaks •Add/Remove: To add or remove peaks from the table •Compound/Mixture/Purity/Similarity:
The peak and multiplet search dialogs have a tool button for changing the search mode. The default mode is "compound", which penalize peaks which are in the query but not in the db spectrum. The default mode can be set in the user preferences.
The scoring by using 'compound search' assumes that the sample is one compound and is based on how well a stored spectrum fits the total query. Score (compound) = 1000*[number of peaks matching in query/total peaks in query spectrum] Peaks or multiplets that are in the query, but not in the stored spectrum, count against the score. This works well for spectra composed primarily of a single compound, but can lead to problems and excess “bad” hits when searching against a mixed sample. Another way that would be useful for binary, tertiary, etc. type mixtures would be a “content” score in which any potential hit is scored based on how well it’s peaks compare back to the queried spectrum. To get a “1000” for a “content” score all peaks in the stored spectrum must be present in the queried spectrum, but there is no penalty for extra peaks in the query spectrum. It is almost a reverse grading of the spectra
For example: If you have a ~50:50 mixture of compound A and compound B and run a query, you get what would be approximately a “500” scores for both compounds using the traditional scoring method. If you were to additionally display the scoring method proposed above, each stored spectrum would get “1000” scores for a “content” grade. This way of scoring would better indicate the presence of particular compounds in the analyzed sample. This would also additionally help to completely rule out compounds that get low grades in the traditional scoring method, but show up in the scoring due to coincidental overlap of multiplets/peaks.
Mixture means that peaks in the query spectrum but not the library spectrum will be ignored. Score (mixture) = 1000*[number of peaks matching in DB spectrum/total peaks in DB spectrum] This is for cases where the query spectrum might be a mixture containing additional compounds and the database has built with pure compounds. It will penalize peaks that are in the database spectrum but not in the query.
Purity Search: unclean spectra in the db (with many spurious peaks) will get low search scores.It will search directly for the best match of the query spectrum. Score (purity) = 1000*[number of peaks matching in query / [ (total peaks in query spectrum + total peaks in DB spectrum)/2 ]
Similarity: intelligent algorithm to search 1D spectra by comparing the area behind the curves.
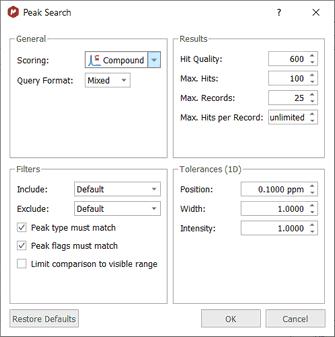
•Parameters: to set the Peak Search method (Compound, Mixture, Purity or Similarity), some settings for the Results, Filters and Tolerances:
The 'Query Format' could be Legacy, JSON or Mixed: Legacy: Used for simple peak search requests in a simple line-oriented format. Number of peaks to search for, followed by one peak per line JSON: Used for simple peak search requests in JSON format. MnServer <r420 only understands legacy format. MnServer >r420 understands both legacy and JSON format.
Hit Quality: Minimum score for search hits to be included in the results. Max. Hits: Maximum number of hits returned by a search. Max. Records: Maximum number of records returned by a search Max. Hits per Record: Maximum number of hits returned per the same record.
Use the filters scroll down menus to select what kind of peaks type you want to include (Compound, artifacts, impurity, solvent, etc) and what type of peaks flags you want to exclude (hidden, weak, rotational, labile, etc). Check the applicable boxes to take into account the 'peak type' and/or the 'peak flag' for the match. You can limit the filters to only the visible range, just by checking the applicable box.
From the Tolerances section, you will be able to select the search tolerance for the peak position (as an absolute value).
The intensity and width are multiplicative tolerances, so for example if you include a tolerance width value of 0.8 and the peak query has a width value of 5; you will get a hit if in the database you have a peak with a width value between 5-0.8*5 and 5+0.8*5 (that is, between 1 and 9). A tolerance value of 1.0 would be a 'special case', where the intensity and width will be ignored to get a match.
•Select from document: to select the spectrum if you are in a document with several datasets.
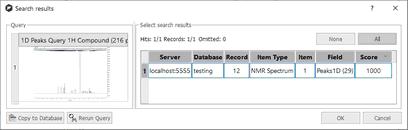
After having clicked on the OK button, the peak search will be run. In the example below, we have obtained a match for the compound number 25, with a score of 1000 (maximum value):
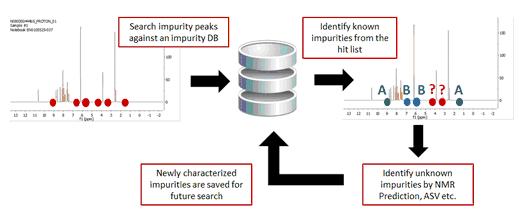
The Peak Search feature (combined or not with the Verification plugin) can be very useful to identify impurities in the datasets.
Please note, that you can also use the 'Peak Search' feature without any spectrum loaded. In that case, you will need to type in the table, the information of the peaks that you want to find in your database:
Alternatively, you can also use the 'Peak Search' feature from a molecular structure with assignments:
If your spectrum has more than one compound, you can run peak searches of only one of the compounds:
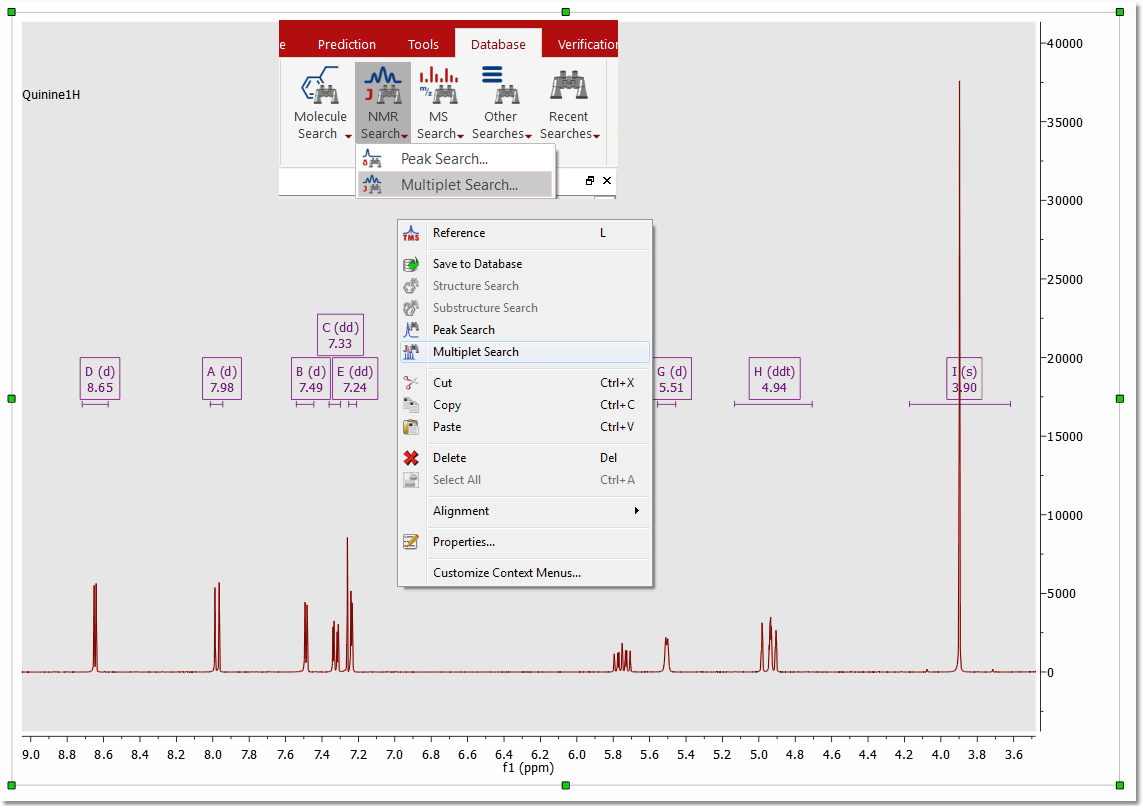
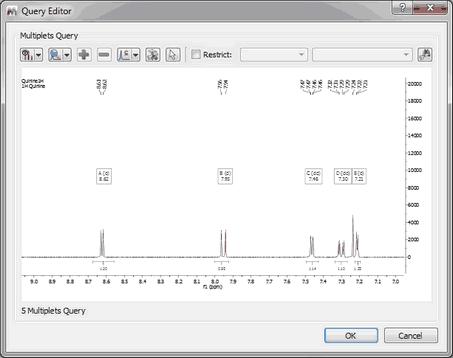
Multiplet Search To search for multiplets, you will only need to open a spectrum with the desired multiplet analysis and finally select 'Multiplet Search' (after having right clicked on the spectral window):
After that, the query editor will be displayed, to how you which multiplets will be searched. This dialog box is similar with the 'Peaks Query Editor' (explained above)
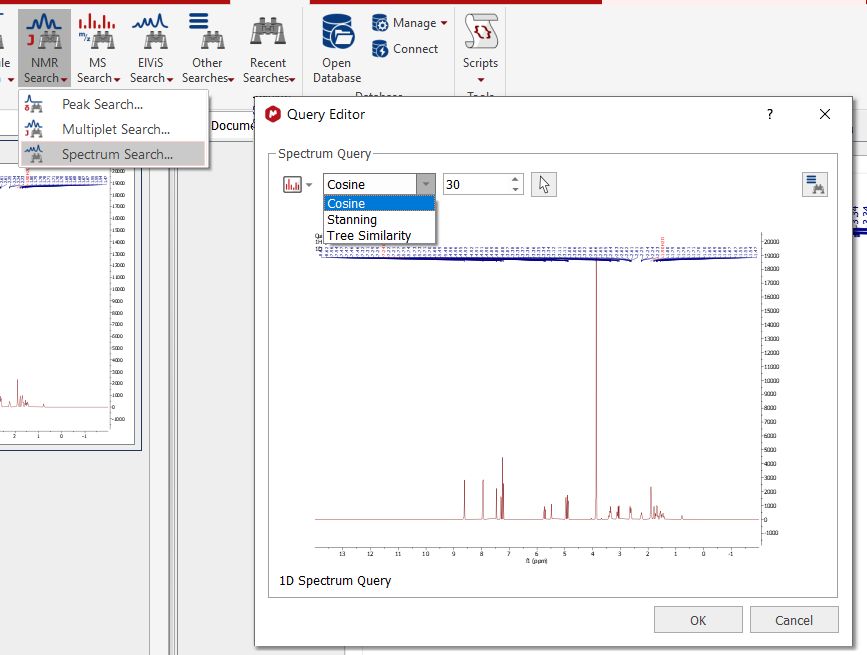
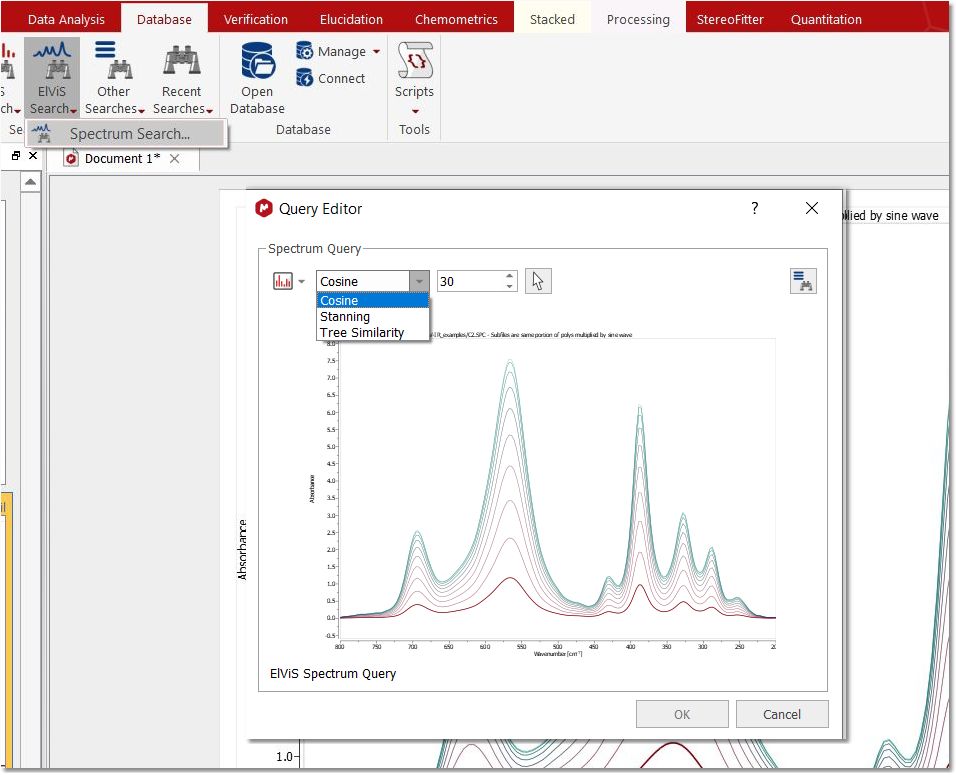
Spectrum Search Spectrum search allows to find spectra in the database which are "similar" to the query spectrum, based purely on shape of the spectrum curve.
Note that this is not the optimal or recommended method to find spectra in the database. We recommend to do a rigorous peak analysis on any spectra saved to database as well as the query spectrum, and then use the Database/Peak search to identify similar spectra.
The methods under spectrum search are experimental and only for unusual situations where a full peak analysis may not be feasible.
The following similarity measures are available:
- Cosine similarity: The classic cosine of the angle between two vectors. The default parameter 30 refers to the number of bins to be used for the query. Higher values mean better discrimination at the cost of lower speed - Stanning: A mathematical sound method to calculate the distance / similarity between two 1D spectra comparing the areas under their curves to each other. - Tree similarity: A tree-based method for measuring similarity between NMR spectra.
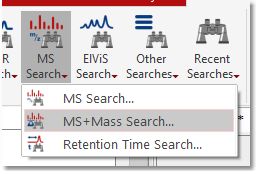
MS Search If you have a MS dataset loaded in Mnova and you select 'Database/MS Search' (or right click/MS Search'), the application will look for these MS peaks in the database.
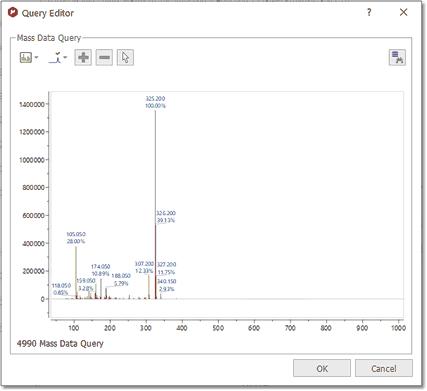
After having selected the 'MS Search' feature; the query editor will be displayed:
From here, you will be able to change the view (preview or plain text), or to select the tolerance of the Mass Item Searches.
Finally, click on the OK button and wait for the result:
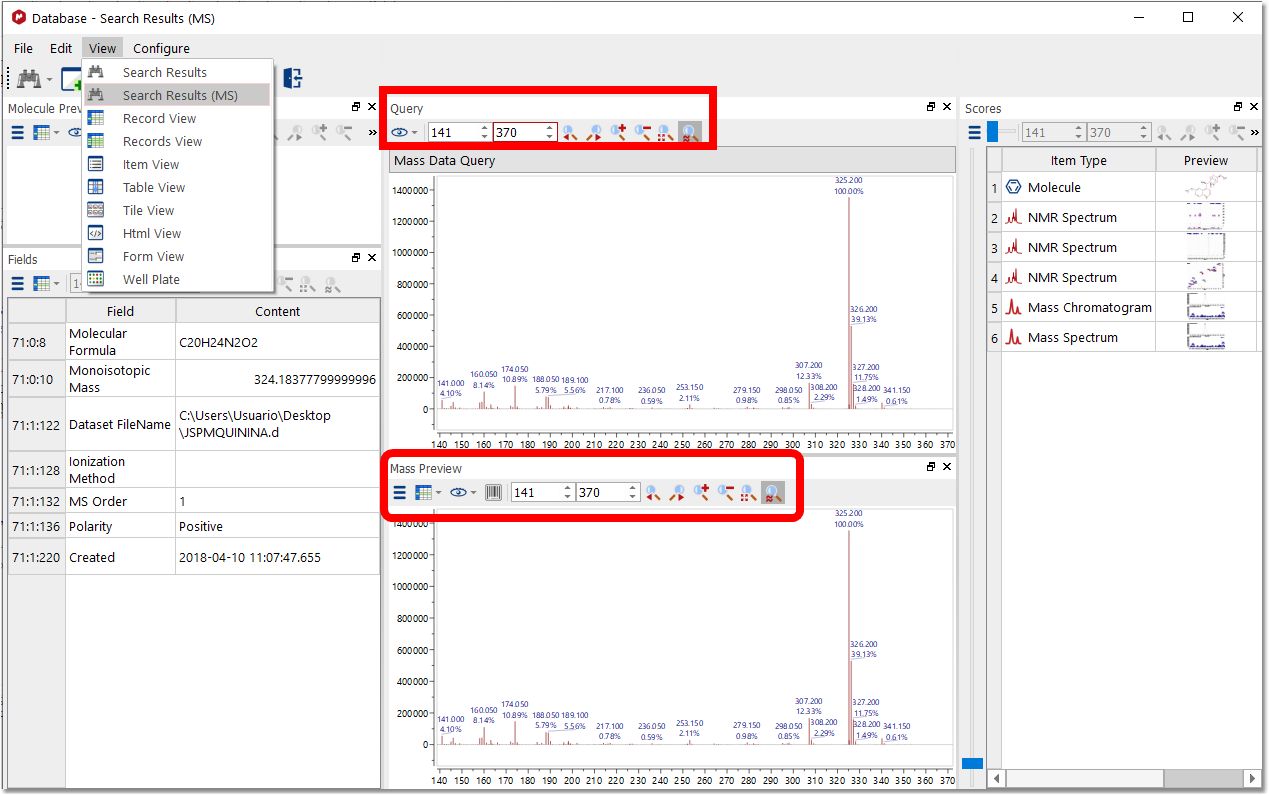
For MS searches, we recommend to use the Search Result (MS) view, which will allow you to compare the Query and the Match and easily apply zoom in, zoom out or to synchronize the retention time ranges by using the zoom toolbars:
NOTE: The Database definition within the MassItem, will include information about: RT, Scan, Type, Height, Area, Total Height %, Total Area %, Start Time, End Time, for each chromatographic peak corresponding to that particular MassItem in each Chromatographic run. The database definition accommodates up to 8 traces (TIC, Total UV (or DAD or PDA), ELSD, CNLD + 4 UV traces as specific wavelengths).
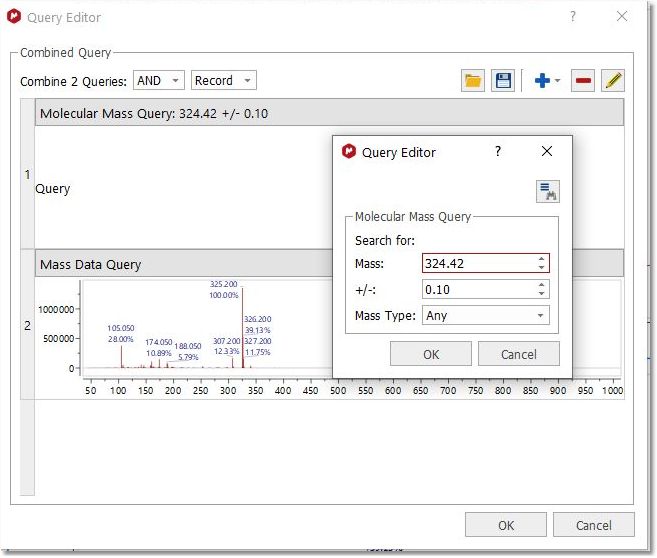
MS + Molecular Mass Search The MS+ Molecular Mass Search will allow you run a combined mass spectrum and molecular mass value query.
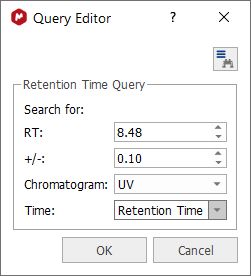
Retention Time Search The´Retention Time Search´ will allow the user to enter a range of retention times and choose to work within the ´RT´, ´Start time´ or ´End time´ fields of the DB, within the Itemtype MassItem.
Elvis Search Use this option to search for your UV, IR or Raman datasets by using 'Cosine', 'Stanning' or 'Tree similarity' methods:
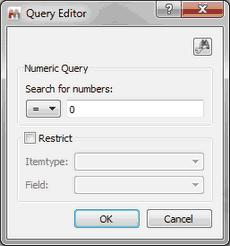
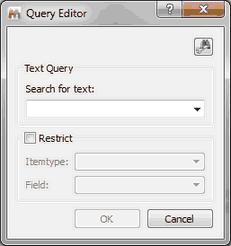
Numeric and Text Search You can search for numbers or for any text in the database just by selecting one of these options:
Please bear in mind that the numeric search can contain ranges like “10 < 20” or “10.2 <= 20.5”.
To search for all the items of your database, type "-" (without the quotation marks) in the search dialog.
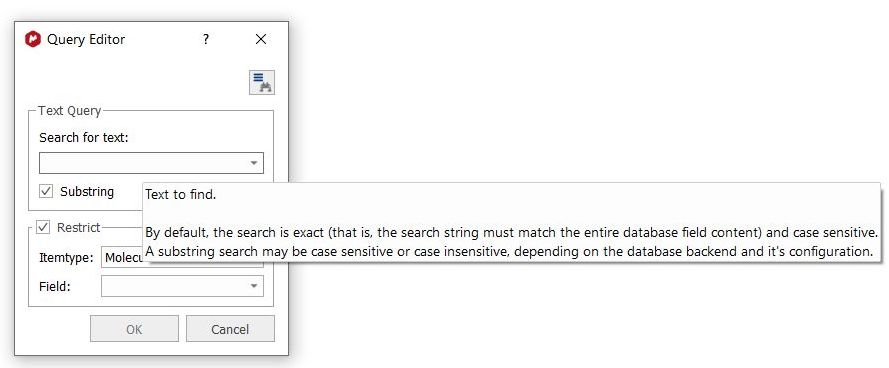
Please bear in mind that by default the text search will be exact and case sensitive.Checking the substring box could allow you to do a case sensitive or insensitive search depending on your DB backend.
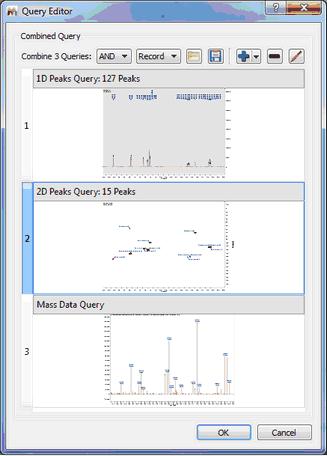
Advanced Searches This option will allow you to combine several queries (in the same document) for the same search. In the example below, you can see how we are combining the peaks of 1D and 2D NMR datasets with the Mass spectrum.
You can look for any of the 3 queries (by selecting 'OR' in the applicable scroll down menu) or for all the queries (by selecting 'AND'). You can also load/save combined queries in XML format, or to add/remove/edit the queries by using the applicable buttons of the dialog box.
The settings specifies how the search results from the subqueries are combined into the single result of the advanced query.
Let A be the results returned by subquery a, and B the results returned by subquery b. Let R be the final search scores of the advanced query. Then, With Combinator = "AND", score(R) = min(score(A), score(B)) With Combinator = "OR", score(R) = max(score(A), score(B))
With combination = records, A and B must be matches within the same record for the subquery results to be combined. With combination = items, A and B must be matches resulting from the same item (in the same record) for A and B to appear in the final result.
So, with your advanced query where for example subquery a="1D Peaks>2" and subquery b="1D Peaks<3", when you select combinator "Records", you will get matches for records which may contain one msitem with 1D Peaks 5 (5>2, match for a) and another msitem with 1D Peaks 1. (match for b). When you select combinator "Items", these matches are excluded as A and B need to occur in the same item for the match to appear in the final result, so you will only get items where both conditions hold true for the same item, which is in effect msitems with both 1D Peaks>2 and 1D Peaks<3.
Combinator "Records" is useful if you want to combine conditions from different items, for example: search for records where "Methyl" appears in the molecule name and which have an NMR spectrum with 1D Peaks between 1 and 3.
|