Pasting Spectra into Reports


Pasting Spectra into Reports |
|
|
When the user copies a spectrum, he is copying a graphic. A graphic is any kind of image displayed by a computer. There are two kinds of graphics: vector graphics and raster graphics. A vector graphic (metafile) is a graphic drawn as lines, polygons and text while a raster graphic is drawn as an array of colored dots (bitmap).
A metafile is a list of commands that can be played back to draw a graphic. Typically, a metafile is made up of commands to draw objects such as lines, polygons and text and commands to control the style of these objects. So, internally, a metafile is an array of variable-length structures called metafile records. The first records in the metafile specify general information such as the resolution of the device on which the picture was created, the dimensions of the picture, and so on. The remaining records, which constitute the bulk of any metafile, correspond to the graphics device interface (GDI) functions required to draw the picture. These records are stored in the metafile after a special metafile device context is created. This metafile device context is then used for all drawing operations required to create the picture. When the system processes a GDI function associated with a metafile, it converts the function into the appropriate data and stores this data in a record appended to the metafile. NOTE: Some people equate metafiles with vector graphics. In most cases this is correct but, strictly speaking, a metafile can contain any mix of vector and raster graphics. For example, a metafile could contain just one command to display a bitmap. This is the approach used in Mnova, which by default pastes the spectrum as a metafile which contains a bitmap in order to reduce the file size (without too great a loss in resolution). Mnova also allows the user to use (only in Windows) the graphical format known as Enhanced Windows Metafiles in order to keep the maximum graphical resolution possible (at the expense of an increase in the file size). This will usually be the preferred way to copy NMR spectra. Enhanced metafiles provide true device independence. You can think of the picture stored in an enhanced metafile as a “snapshot” of the video display taken at a particular moment. This “snapshot” maintains its dimensions no matter where it appears—on a printer, a plotter, the desktop, or in the client area of any application. You can use enhanced metafiles to store a picture created by using the GDI functions (including new path and transformation functions). Because the enhanced metafile format is standardized, pictures which are stored in this format can be copied from one application to another; and, because the pictures are truly device independent, they are guaranteed to maintain their shape and proportions on any output device. In addition, the user is able to work with the copied spectrum in the document just by double clicking on it (Mnova will automatically open due to the Object Linking and Embedding technique; OLE). A bitmap is another name for a raster graphic. In Windows, these are typically saved in a BMP file. However, other common bitmap formats include PC Paintbrush (PCX), Tagged-Image File Format (TIFF), Graphics Interchange Format (GIF) and JPEG. In general, vector graphics take longer to display but can be scaled to any size with no degradation, whilst raster graphics are faster to display but image quality suffers when they are scaled up or down. See also this post: How to paste a spectrum in a Report? Mnova provides the ability to copy&paste spectra into other applications (e.g. MS Office apps) via the clipboard. Just be sure that you have highlighted the desired objects (Edit/Select All, if you want to select all the objects) and then follow the menu 'Edit/Copy' or alternatively use the shortcut 'Ctrl+C' (or 'Cmd+C' in Mac). You can also select the page on the page navigator and do Ctrl/Cmd+C (or right click->Copy) to copy to the clipboard all the content of the page.
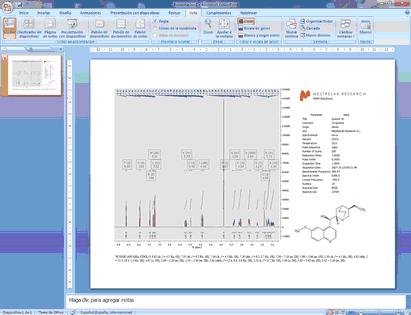
Next, open the document (PowerPoint in this case) where you want to paste the spectrum and follow the menu Edit/Paste or alternatively use the shortcut, Ctrl+V (or Cmd+V in Mac).
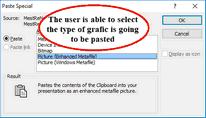
Mnova will copy to the clipboard, by default, the object as a metafile. This object will have OLE properties in Windows, so the user will be able to work with the copied spectrum in the document just by double clicking on it (Mnova will automatically open due to the Object Linking and Embedding technique; OLE). Please bear in mind that the size of this 'image' will be bigger than a regular image, because you are storing the FID to allow Mnova to reprocess the NMR spectrum in the future if it is needed. However, the user can change this default by following the menu 'Paste/Paste Special' (or Ctrl/Cmd+Alt+V) before pasting (in the corresponding document; PowerPoint in this case). It will open the 'Paste Special' dialog box where the user will be able to select between Mnova Document (by default), Enhanced Windows Metafile, Bitmap, etc.
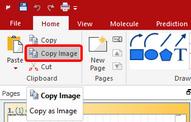
The user can also copy the spectra just as an image (very useful for large datasets) by following the menu Home/Clipboard/Copy as an image'. This will reduce the file size of the document but the image will not contain OLE properties.
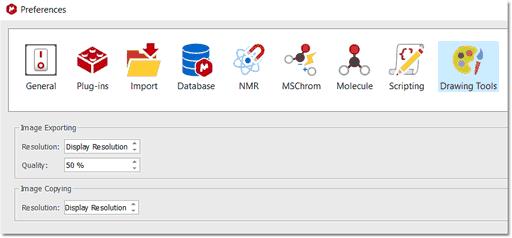
From the 'Drawing Tools Preferences', you will be able to select the exporting 'Resolution' and 'Quality' of the graphics and also the resolution of the image copying:
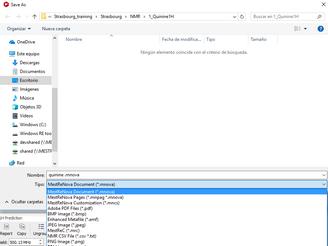
The user can also save the spectrum by following the menu 'File/Save as' and then 'paste it' in the corresponding document by selecting 'Insert/Picture'. Mnova allows the user to save the data in Mnova (*.Mnova) or MestRe-C (*.mrc) formats as well as in ASCII text (*.txt), adobe PDF or several kinds of image files, such as bitmap (bmp), enhanced metafile (emf), JPEG, PNG, SVG, TIFF, XBM, XPM, etc...
'ASCII Text File' (*.txt): It is essentially raw text just like the words you are reading now. Each byte in the file contains one character which conforms to the standard ASCII code. This kind of text file becomes a common denominator between applications which do not import each other's formats. If both applications can import and export ASCII files, you can transfer your files between them. Almost all word processors import and export ASCII files as well as many database and spreadsheet programs.
'Adobe Text File' (*.pdf): Portable Document Format (PDF), is an open file format used for representing two-dimensional documents in a device independent and resolution independent fixed-layout document format. Each PDF file encapsulates a complete description of a 2D document which includes the text, fonts, images, and 2D vector graphics which compose the document.
'JPEG Image File' (*.jpg): JPEG stands for Joint Photographic Experts Group; it is a lossy compression algorithm which has been conceived to reduce the file size of natural, photograph-like true-colour images as much as possible without affecting the quality of the image as perceived by the human sensory engine.
'PNG Image File' (*.png): PNG (Portable Network Graphics) is another bitmapped image format which employs lossless data compression.
XPM Image Files (*.xpm): XPM stores image data in the form of ASCII text formatted as a Standard C character string array. This type of format allows XPM files to be edited easily with any text editor, to have comments inserted at any point within the file, to be included as data in C and C++ programs, and to be easily transmitted via electronic mail. |