Peak Detection (Integration)


Peak Detection (Integration) |
|
|
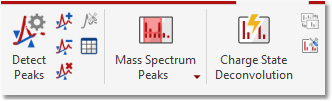
It is possible to integrate the desired peaks of your TIC chromatogram with Mnova MSChrom by following the menu 'Mass Analysis/Peak Detection' or by using the corresponding icon of the toolbar:
You will find several features under the 'Peaks Detection' menu:
Detect Peaks: applies an automatic peaks detection to your TIC.
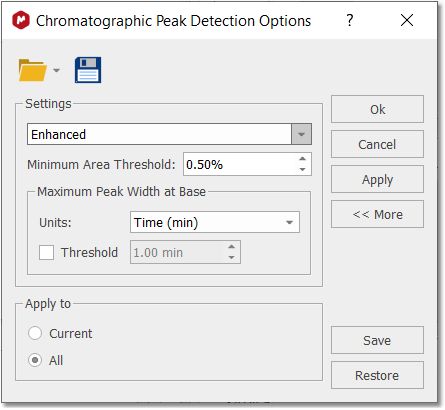
Detect Peaks Options: from here you can select the Peak Picking algorithm (Enhanced will be the default one) and you can also customize the threshold of the minimum area of the peaks for the automatic detection.
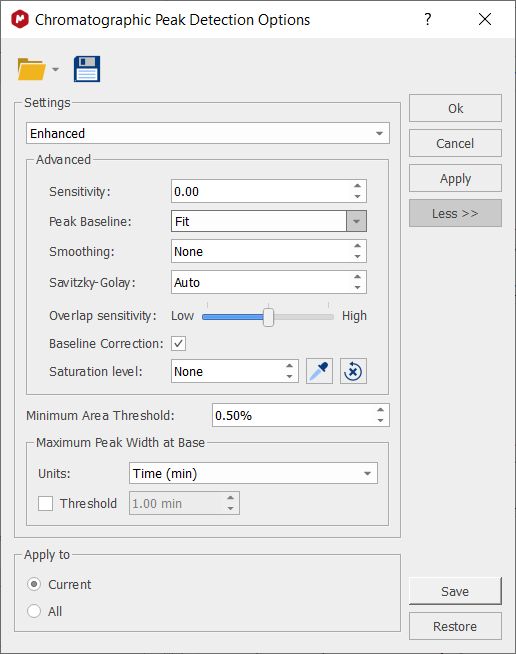
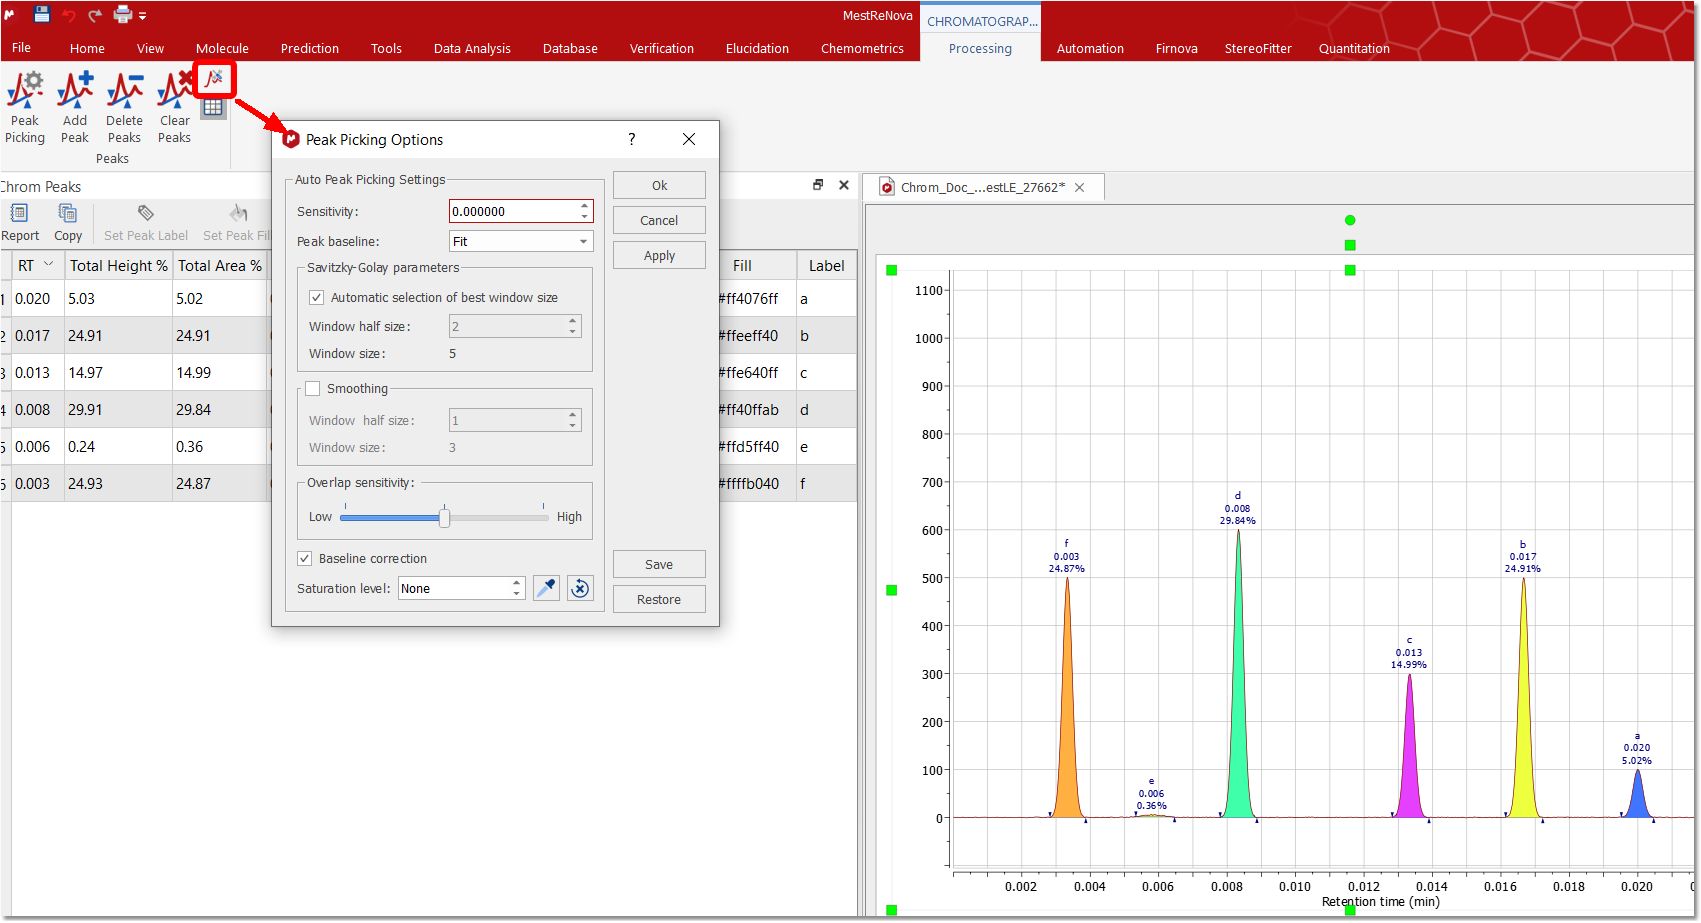
The maximum peak width at base is a filter which discards peaks with a width at base (x.end() - x.start()) greater than a threshold. The threshold can be indicated as an absolute value (in minutes) or as a percentage of the total time of the chromatogram. Clicking on the 'More' button will allow to select other advanced options; such as Sensitivity, Peak Baseline, Smoothing, Savitzky-Golay, Overlap sensitivity, Saturation level and Baseline Correction.
Peak Baseline: the scroll down menu will allow you to select between Fit or Absolute. Fit means that the baseline is built connecting the boundaries of the detected peaks. Absolute always uses zero as baseline (it is intended for baseline corrected signals). Anyway, the baseline of any peak is modified, if necessary, to ensure that the baseline will be always below the chromatogram signal. The default option is Fit.
The Savitzky-Golay option sets the window size (in points) for all the Savitzky-Golay (SG) filters (1st, 2nd and 3rd derivatives) that are internally used by the "Enhanced" peak detection process.
The smoothing option uses Moving Average filter to smooth the signal with the defined window size (in points). If you activate smoothing, the Savitzky-Golay option will be automatically set to "Auto".
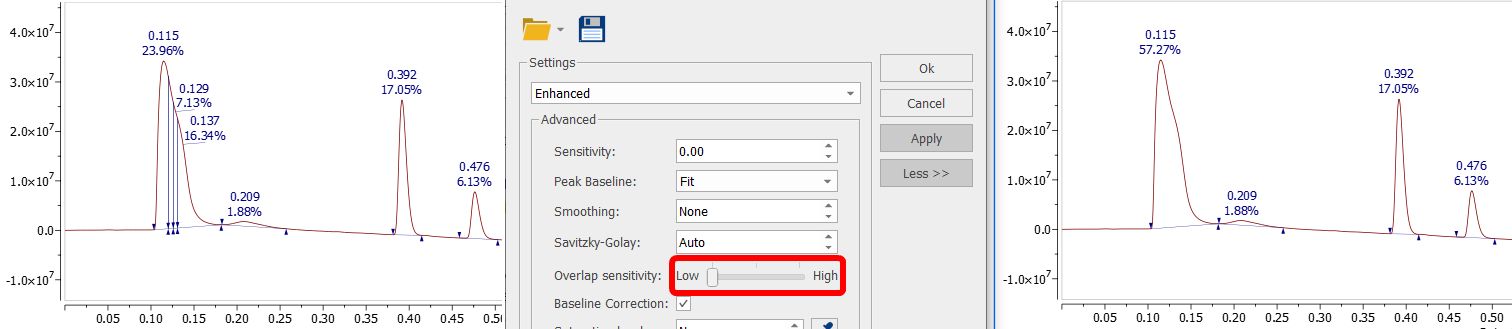
Overlap sensitivity: this option represents different levels of sensitivity for the search of overlapping peaks (by using the third derivative) of chromatograms with good definition. It may not work fine with noisy chromatograms.
High ("3rdDerivative"): equivalent to activating the deprecated "Sensitive overlap" option. This level uses 1st, 2nd and 3rd derivatives to search for overlapping peaks. Medium ("2ndDerivative"): this is the default level. It uses the 1st and 2nd derivatives to search for overlapping peaks. Equivalent to disabling the deprecated "Sensitive overlap" option. Low ("1stDerivative"): a new overlap sensitivity level that only uses 1st derivative to search for overlapping peaks. This option should fix the overdetection of overlapping peaks for those 'uggly peaks' as the one showed in the screenshot below:
Baseline Correction: This option performs a baseline correction of the signal just before the start of the peak detection process (but after the smoothing step, if present). This correction is for internal use of the peak detection process: it does not modify the signal intensity of the chromatogram.
Saturation Level: it allows you to set an abundance level (in height) to identify those peaks that might be saturated, to keep them out from results processes. When using this option, all traces chromatogram points above the saturation level will be removed from the peak detection process. Therefore, these saturation ranges will always be integrated into the same peak: the imaginary peak constructed with the ramp and tail before and after the saturation range.
A value of 0 indicates that saturation detection is disable ("None"). You can type the value in the edit box or select it graphically in the chromatogram (by using this
The Mass Peak table has a new column "Flags": the "Saturated" flag is set to those peaks that have been detected as saturated (the user can not modify this value). Also, the label "Saturated" is added to those peaks (this label is editable).
In general, the enhanced method shows better baseline for the peaks detected than the classic algorithm. To make sure that all the peaks and shoulders are automatically detected, you will need to play with the sensitivity or with the Savitzky-Golay smoothing parameters.
Selecting the classic method, will allow you to customize the threshold of the minimum area of the peaks for the automatic detection. You can also define the regions to be excluded and the Pick the maximum Peak Width at base.
Sensitivity can be 0 to 200. In general, it shouldn't go below 50 or above 80.
A smoothing Window size less than 5 means to automatically decide on a smoothing window based on the noise level of the chromatogram. If a nonzero window size is given, it must be an odd number between 5 and 151.
Shoulder sensitivity has an unknown maximum. It should not be changed from the default value of 0.1
When the wide peaks flag is set it indicates that adjacent chromatogram peaks should be combined into a single large peak.
You can also select the Peak Detection options in the chromatographic plugin, by clicking on the highlighted button below:
Add/Delete and Clear Peaks: these features are used to manually add or delete peaks to your TIC or to delete all the peaks.
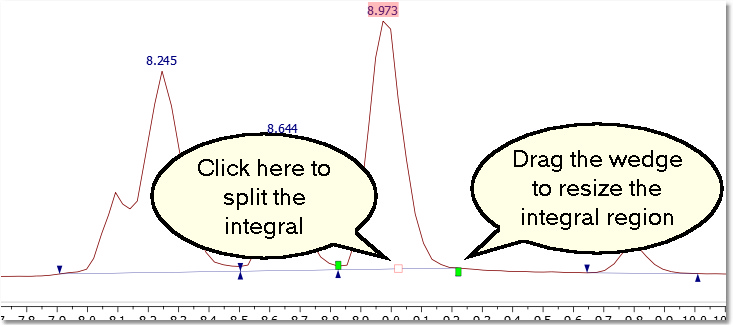
Please bear in mind that it is possible to change the integral region of any peak just by clicking and dragging on the wedges. You can also split the integral peak by clicking on the red square (and dragging).
You can freely move the wedges by moving the integrals handler while shift is pressed.
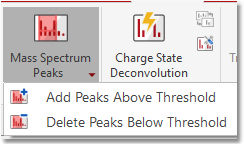
Add/Delete Peaks (Threshold) You can graphically add peaks above a threshold and delete peaks below a threshold:
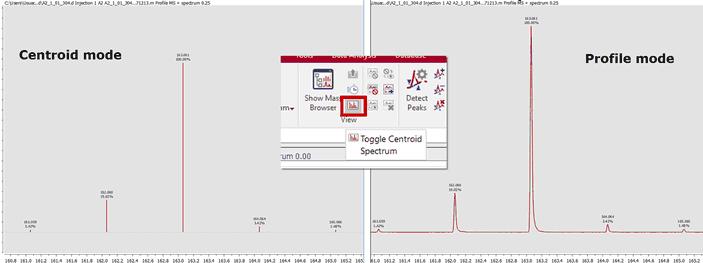
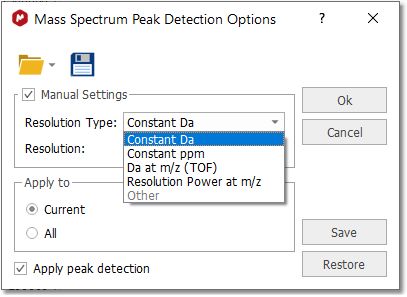
Toggle Centroid Spectrum: This is a toggle to switch between profile and centroid mode of the MS spectrum.
The user can manually adjust the peak detection settings, allowing to specify the desired resolution to build the centroid spectrum:
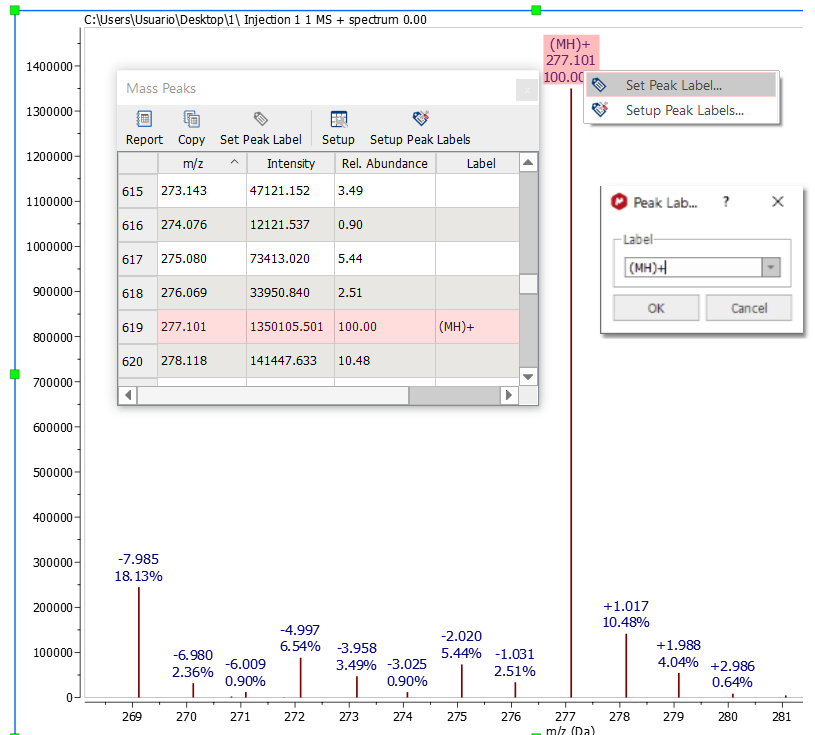
All peaks will be listed in the peaks table which will be displayed by following the menu 'View/Tables/Mass/Mass Peaks' (or by clicking on the 'Show Peaks Table' button of the ribbon). You can label any peak by right clicking on the peak label (or from the Mass Peaks Table):
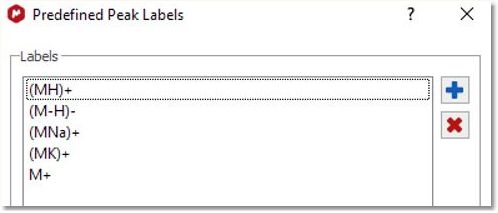
Predefined labels for mass spectrum peaks can be configured by selecting "Setup Peak Labels" .
You can export mass peaks as ASCII by following the menu 'File/Save As' and selecting the option "Script: Mass Peak Table (*.csv *.txt)". You will get a list of m/z and Relative Abundance. You can follow the menu 'Tools/Export/MS Peaks (or MS Data for the chromatograms). |