TD Quantitation


TD Quantitation |
|
|
This feature will be used for the processing and analysis of low-field, time domain data acquired in Oxford Instruments.
See this paper for further information.
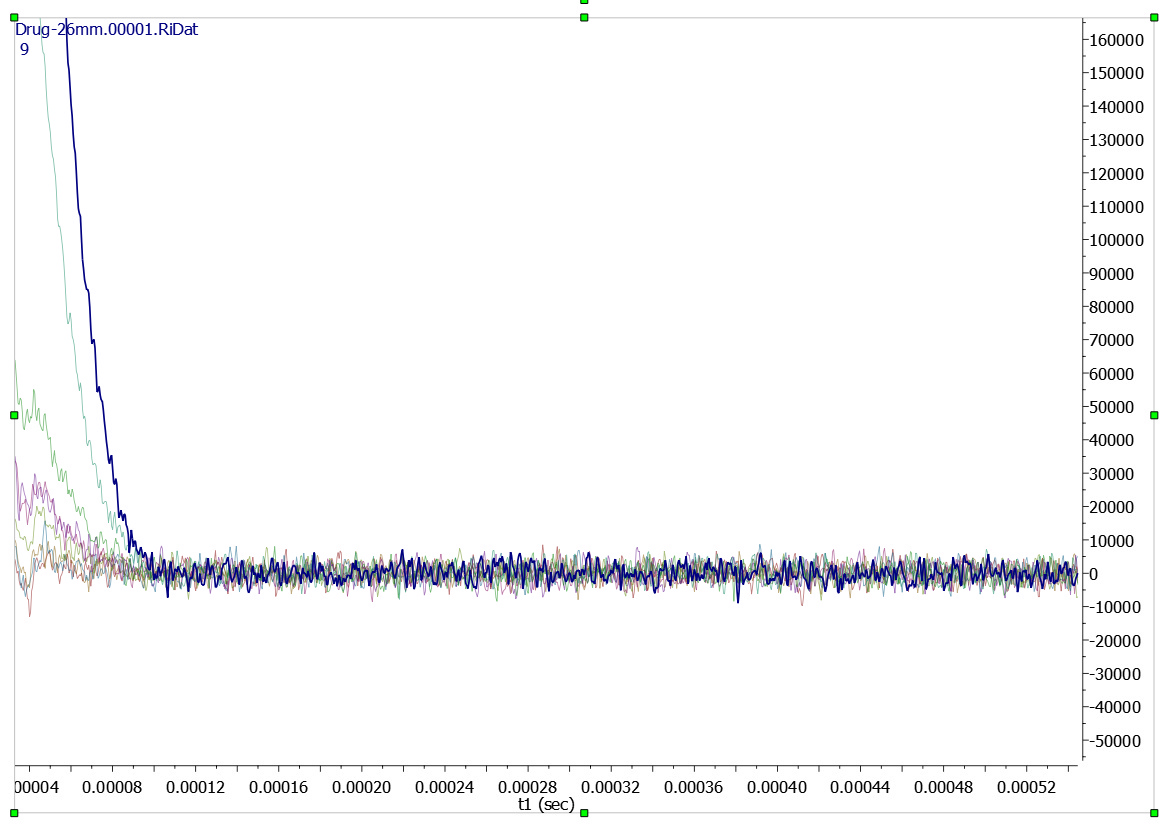
First of all, you will need to load the NMR spectra which will be automatically displayed as an overlaid plot of FIDs. It is recommended to start with the datasets which belong to samples of known concentration, in order to build a calibration curve:
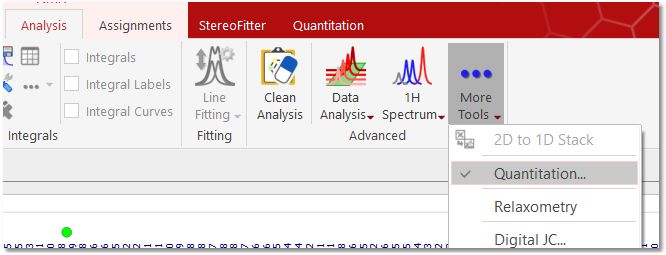
Next follow the menu 'Analysis/More Tools/Quantitation":
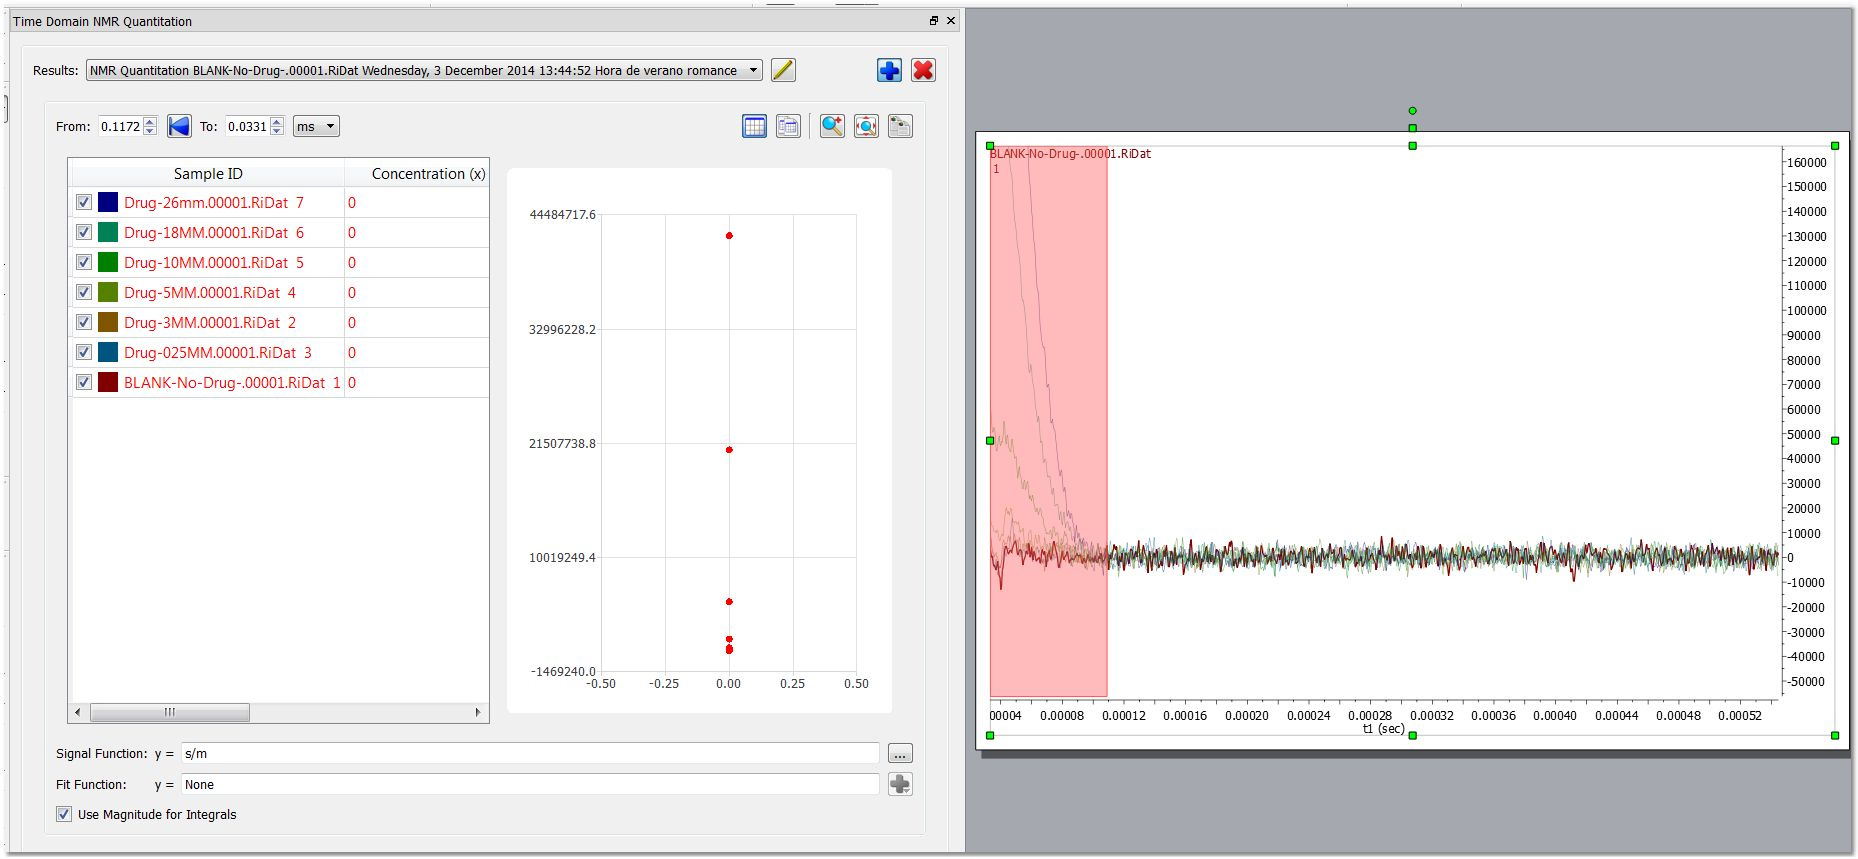
That will display the TD Quantitation window. Clicking on the 'blue plus button'
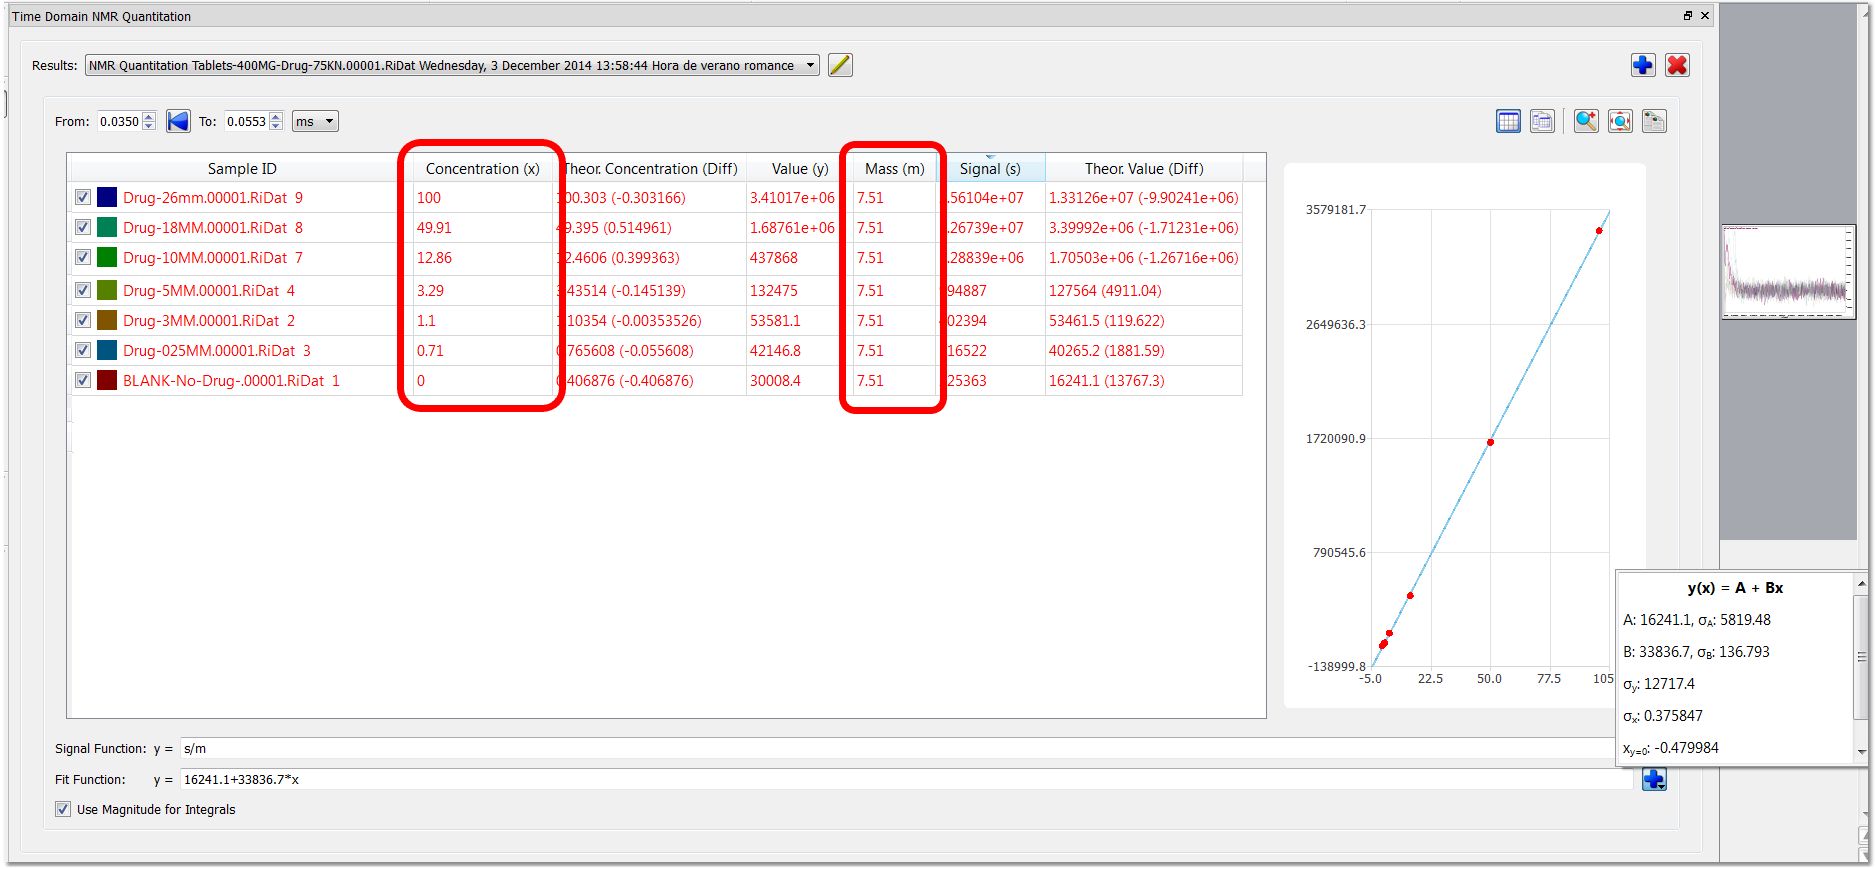
The next step will be fill the concentration and mass columns with the known values (for each of the samples used as reference):
Automatically, we will get a calibration curve with a fit function which will be used to calculate the concentration of unknown samples. Statistic information can be displayed by clicking on the plus button besides the Fit Function.
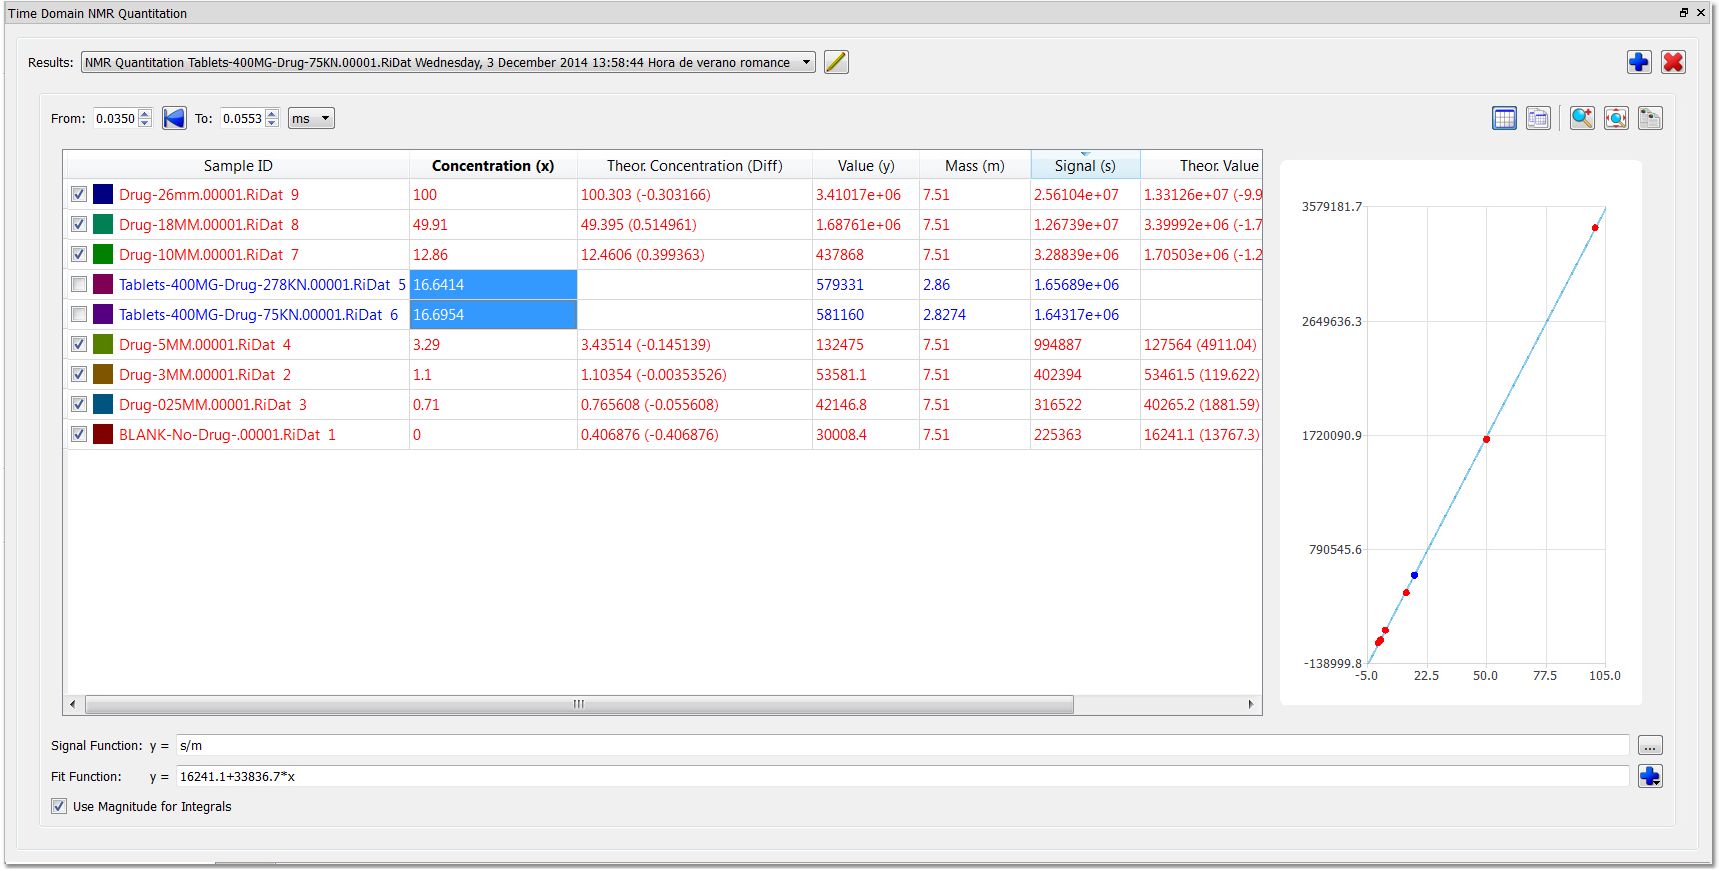
The next step will be to load the datasets of the unknown samples and enter the mass values for each of the samples. Automatically, we will get the applicable concentration values (according to the calibration curve):
As you can see in the screenshot above, the known references used for the calibration curve appear in red and with the check box selected, whilst the samples to analyze appear in blue and unchecked. |