Molecular Match


Molecular Match |
|
|
Molecule match analysis determines the possible presence of a given structure or structures within a mass spectral data set. The molecular ion cluster of each structure is computed and compared to each spectrum in the data set. If one or more spectra contain the computed isotope cluster within reasonable matching constraints, the most intense spectrum within the most closely matched chromatographic peak is returned as a positive result. Structures not matched are assigned a “not found” result. The constraints dialog allows the user to select one or more adducts, specify ion polarity, and other parameters. The algorithm makes use of fast isotope cluster calculations and a sophisticated spectral matching technique. Molecule match analysis is very general purpose. Applications include small molecule confirmation and metabolite identification. Limitations are few but include the requirement that the acquired spectra of the compounds being analyzed exhibit at least partial molecular ion clusters.
The 'Molecule Match' is very useful to see if a mass spectrum and a GC chromatogram match with one of the molecular structures of the document.
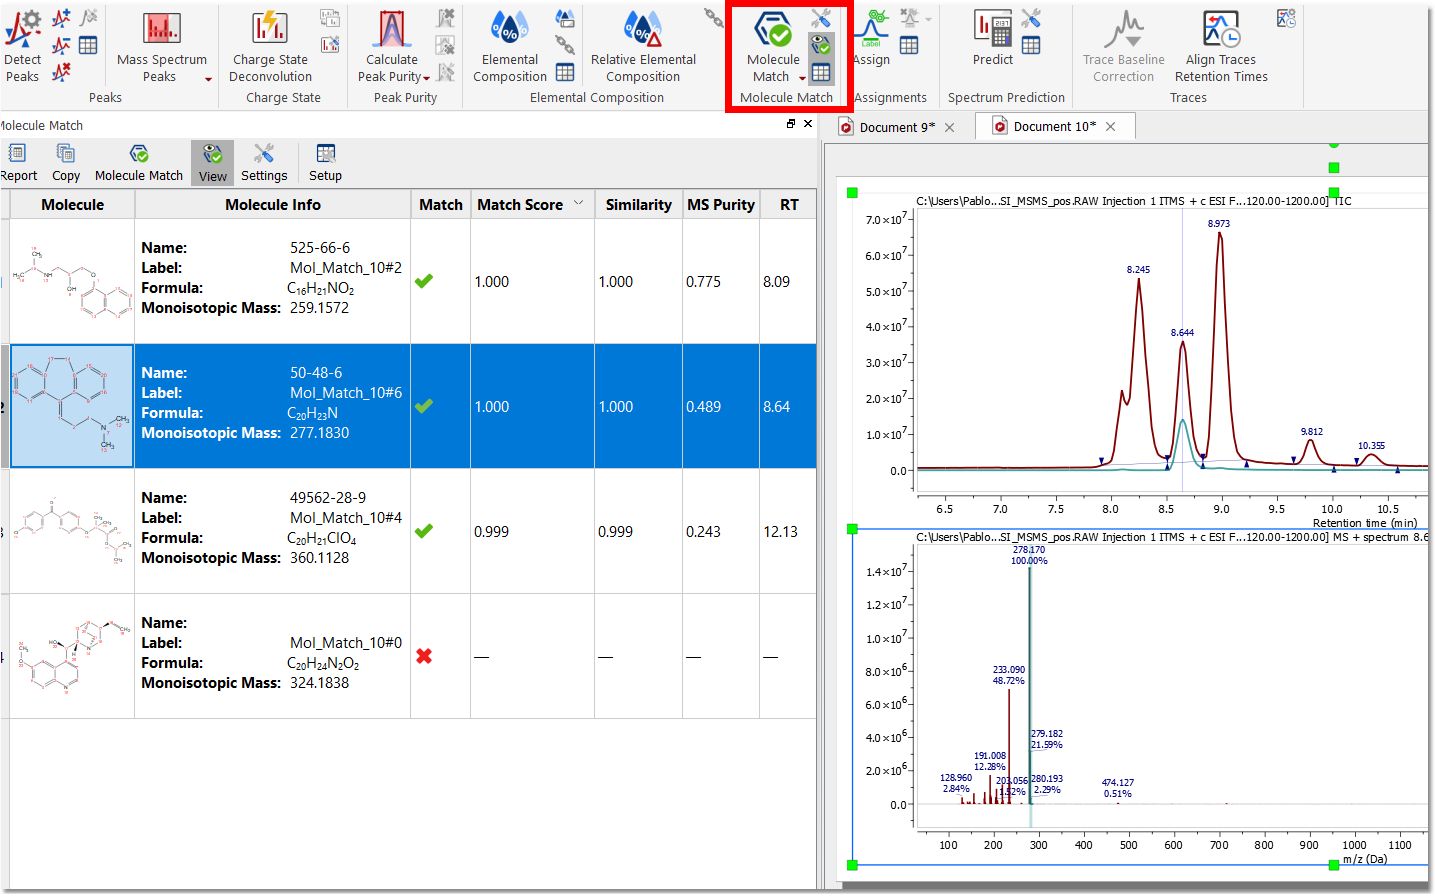
Just load your spectrum (TIC and MS) and paste the molecular structures into any page of the same document (or load whole spectral libraries by opening an sdf file). Next click on the 'Molecule Match' button of the toolbar.
The 'Molecule Match' table with the results will be displayed (this table can also be found under the 'View/Tables' menu). This table will contain information about the 'Retention Time' (RT), Scan (number of spectrum), Match Score, Similarity, MS Purity, etc.. Similarity is the comparison of the computed isotope cluster spectrum of a given molecule's molecular formula, plus optional adduct - that is, the mass spectral peaks of the molecular ion - with the mass peaks of the acquired spectrum in that mass region. The similarity value can be from 0 to 1, and you will note that a threshold of 0.8 is used. For instance, a pesticide named Pydrin, with a molecular formula of C25H22NO3Cl, plus an adduct of H, has an isotope cluster of 420.137 - 100%, 421. 140 - 28%, 422.135 - 36%, 423.137 - 10%, 424.140 1.5%. This is compared with the mass peaks of the acquired spectrum in the mass range of about 420 to 425. Match Score is the product of Similarity and MICC value (see below). So, basically, for each proposed structure’s molecular formula, with the given ionization mode (such as protonation), a molecular ion cluster spectrum is computed. Each molecular ion cluster spectrum is then compared to every spectrum in the LC- or GC- MS run, and ranked according to spectral similarity, where 1.0 is identical within the m/z region of the molecular ion cluster. This ranking is further refined by taking into account the response of a molecular ion chromatogram (or chemical chromatogram) , which also has a maximum value of 1.0. The final match score is the product of the two metrics. The MS Molecule Match similarity measurements are derived from traditional dot product calculations and take into account a user specified m/z accuracy, to make full use of accurately mass measured mass spectral data. If MS/MS spectra are also present in the data set, the structures are used to predict fragment spectra, and these predicted fragment spectra are compared with the acquired MS/MS spectra. Purity is the ratio of the matched peak area (in the TIC) of the signals of matched compounds. Clicking on any "matched molecule" will display the MICC (Molecular Isotope Cluster Chromatogram), overlaid with the TIC. The MICC shows the summed response of the isotope cluster for each MS spectrum over the entire data set. The MICC is the sum of the mass chromatograms of each m/z value of an isotope cluster. In this example, the best result was for the compound number 1 (C20H23N). You can see in the picture below the MICC (in green) over the TIC (in red):
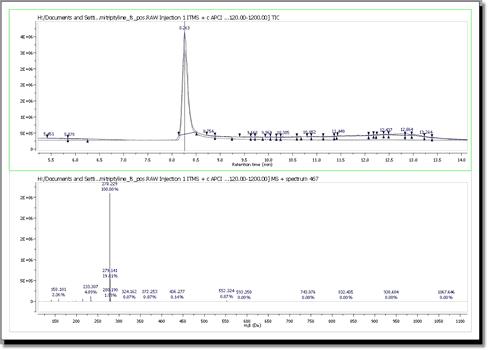
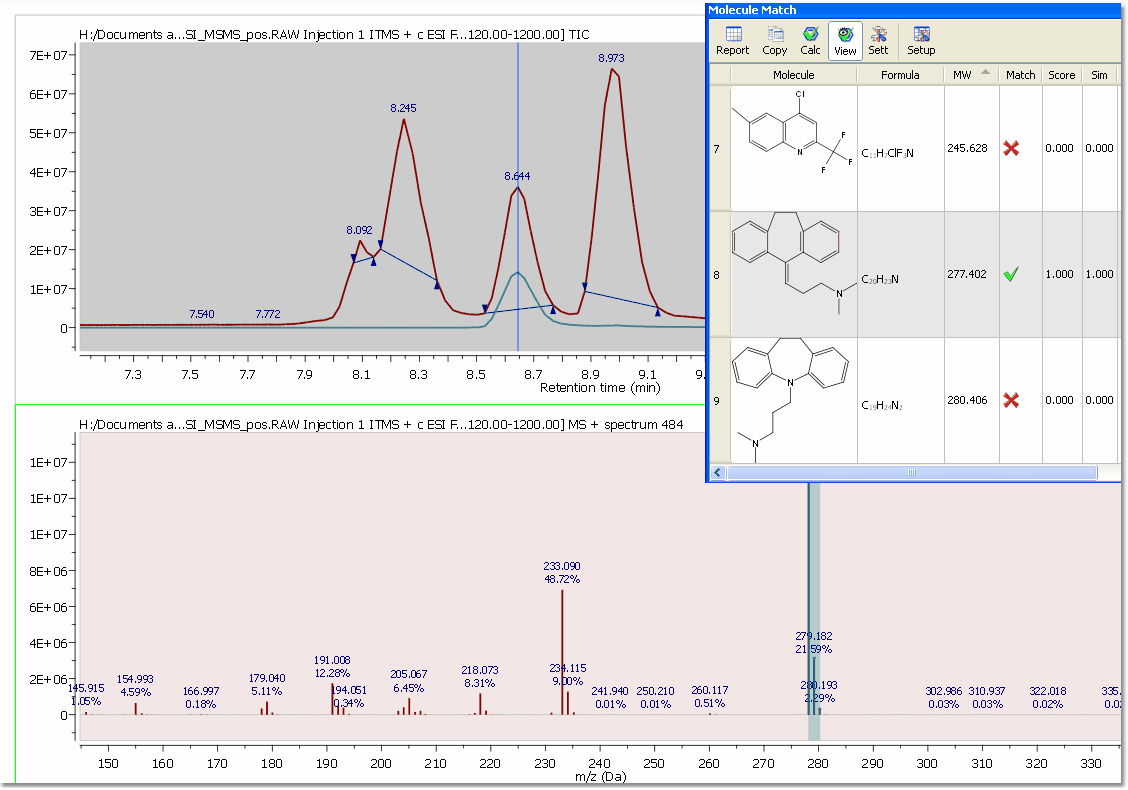
In addition, Mnova shows you in the chromatogram the retention time of the match (with a blue vertical line) and displays the corresponding MS spectrum (the number 467 in this case) overlaid with the theoretical one (in green at a M/Z around 278, in this case). It is possible to show/hide the MICC and the theoretic MS just by clicking on the 'View Molecular Match' icon Here you can see another example, where the compound 8 (amitriptyline) is present in the mixture:
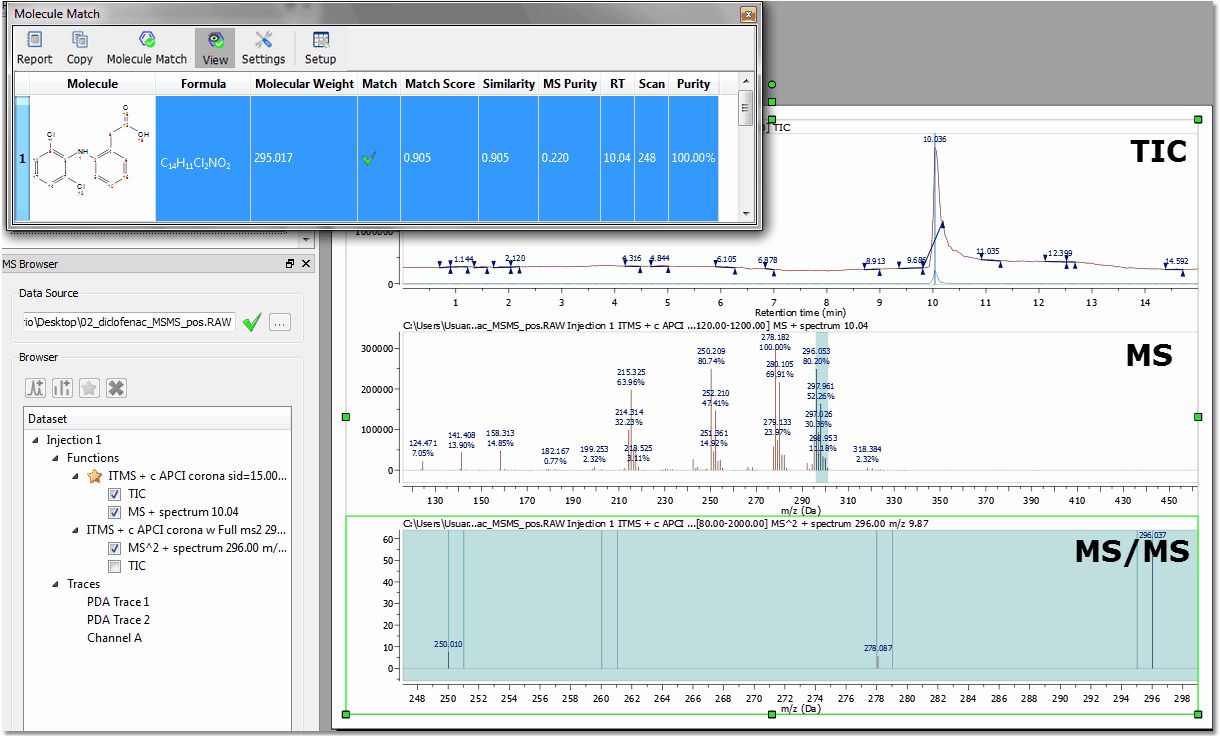
You can also run Molecular Matches with MS/MS spectra and see the result directly in the MS/MS plot. Here you can see an example:
Clicking on the 'Report' button will paste the content of the Molecular Match table into your Mnova document.
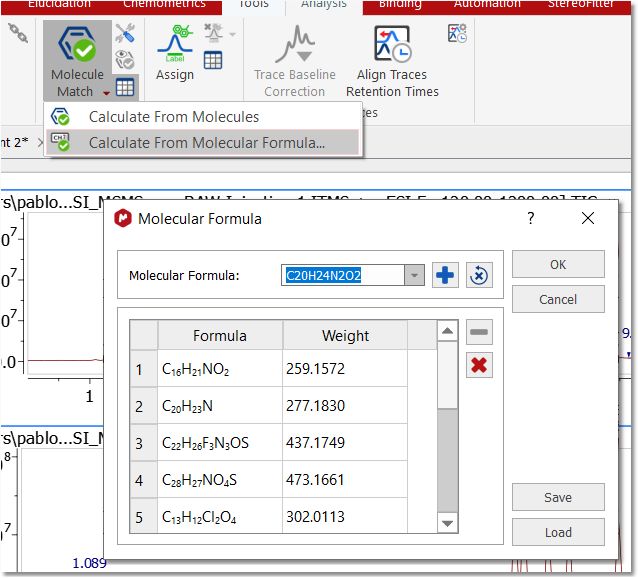
The user can also run the 'Molecular Match' feature just by entering a molecular formula after having clicked on the 'Calculate From Molecular Formula' in the applicable scroll down menu:
You can save the list of molecular formulas by using the 'Save' button.
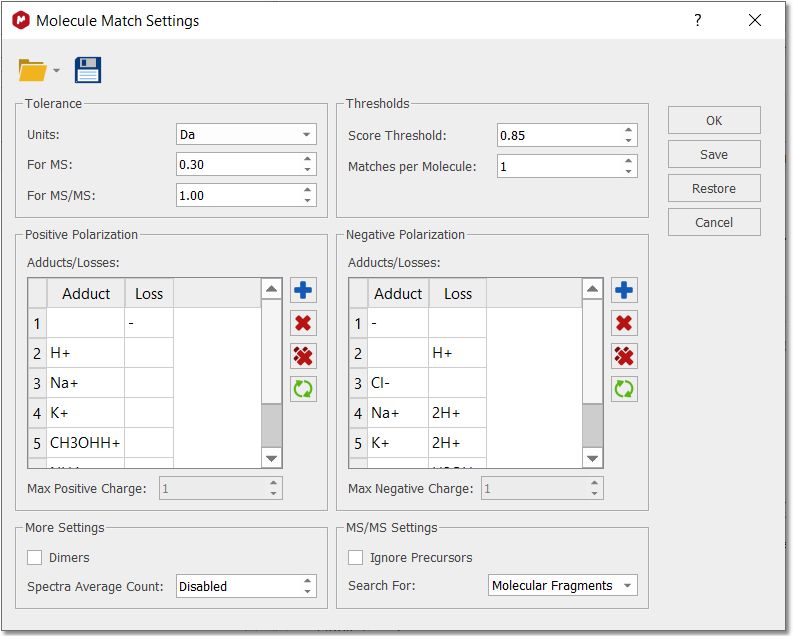
Select 'Settings' on the 'Mass Analysis/Molecule Match' to display the 'Molecule Match Settings' dialog box:
Tolerance: To set the m/z tolerance for matching predicted spectra to experimental; by default, MS spectra are matched to either 5 ppm or 0.5 Da, and MS/MS to 10 ppm or 1.0 Da, depending on whether the spectra are derived from high or low resolution instruments.
Thresholds: Set match score threshold for acceptable result; in most cases the default value of 0.5 is more than enough, however for weak / noisy spectra, the threshold may be lowered.
Matches per molecule: To set the maximum number of results per molecule; by default, a molecule is allowed to match only once, in which case the best result is returned. However, if no MS/MS spectra are available and the sample is known to contain isomers, then increasing this limit will allow the molecule to match every isomer peak.
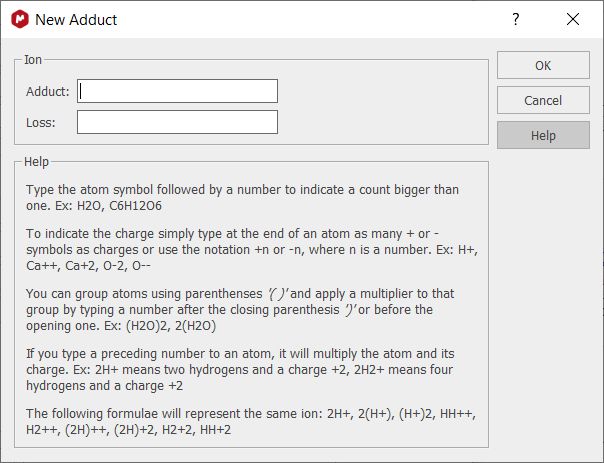
Adducts: Set adduct/loss pairs using proper atomic or chemical formulas with charge notation. Clicking on the blue plus button will allow you add new adducts. Clicking on the Help button will display further information about the formula syntax:
Charges: Set maximum charge states to consider. By default, +/- 1 are the maxima. This option in Positive or Negative Polarization is enabled only when no adduct/loss is added in the list.
Note: If the molecule is charged with the same polarity as the MS data, then no ionization stage is done and the charged molecule is searched into the MS data: [M +n]. If the molecule is neutral or the charge is not the same as the polarity: If there are adducts in the settings, those adducts will be used to search an ion composed by the M+A−L (M: molecule, A: adduct, L: loss) If there are not adducts, then the max charge count setting is used and the ion is composed by simply charging the molecule from 1 to the number of maximum charges seleted: [M] + ... [M] +n
Dimers: Set to enable consideration of dimers when matching; by default, dimer matching is disabled. A dimer (in this case) is a non-covalently bound molecule pair (e.g. bound by van der Waals, hydrogen bond, or electrostatic forces, not a covalent inter-atomic bond). If you have a molecule M, then in ESI+ it normally gives an [M+H]+ ion. If it forms a dimer in the ESI source, then the ion observed is [2M+H]+, and the m/z value we look for is twice the mass of M plus the mass of H.
If the Dimer setting is on, it will search in addition: If the molecule is charged: Twice the charged molecule: 2[M +n] If neutral: Twice the molecule plus the adduct minus the loss: 2M+A-L Twice the molecule plus the charge from 1 to max charge state set in settings: [2M] + ... [2M] +n
Ignore Precursors, when checked, it will ignore the precursor information when searching for fragments in MS/MS spectra. Until version 14, when matching the molecular fragments in MS/MS data for a given molecule, the precursor m/z for the MS/MS spectrum should match the molecular mass for the provide molecule. If this setting is set, then that check is not made, so the fragments will be searched in all the MS/MS spectra regardless its precursor. This setting must be used with care and only in very specific cases, because it could increase the false positives. The Search For setting can be used when we have only MS/MS data. Until Mnvoa 14, we were searching always for fragments, but now we can instruct Mnova to search for the molecular ion in the MS/MS data (like we are doing for MS data). |