Integration


Integration |
|
|
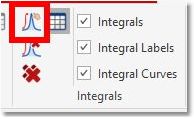
Mnova ElViS implements a manual integration feature which can be applied over one single spectrum or to a stacked plot. You can use the 'Manual Integration' button from the ribbon (or the shortcut: I) and next click and drag over the region of interest:
You can use the check boxes of the ribbon to hide/display the integrals, labels and curves. The first integral will be normalized to 1.0. All following integrals will be referenced relative to the first integral.
All the integral curves are mouse-sensitive and they respond to usual mouse operations. If you want to move up or down all the integrals, just click and drag (with the left mouse button) over anyone of the integrals (notice that hovering the mouse over the integral will highlight it in red). If you keep pressed the SHIFT key at the same time, the height of the integral curves will be changed.
The same effect will be obtained if you hover the mouse over integral curve, click on one of the green squares and drag the mouse up or down.
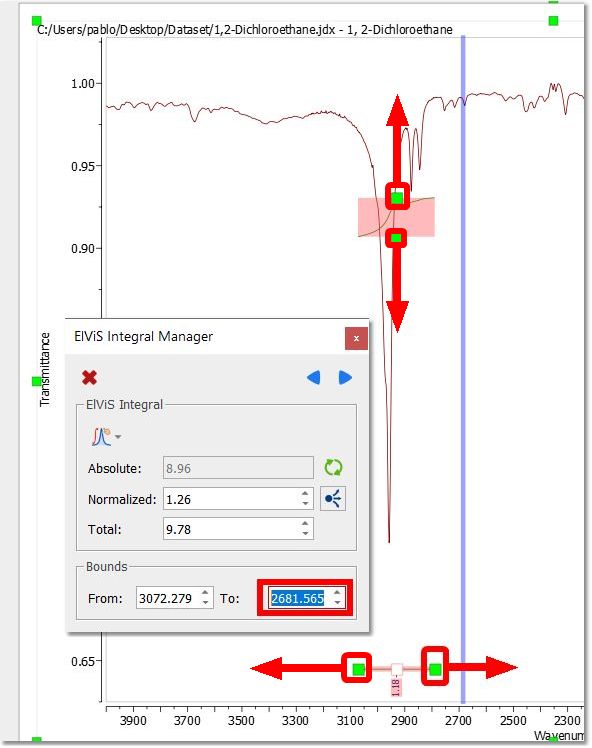
If you want to change the range of the integral, do the same with the integral label (notice that once you hover the mouse over the green squares of the integral curve or label, the mouse pointer turns to vertical or horizontal arrows, respectively). The integral regions can also be resized the 'Integral manager' which can be accessed by double clicking on the integral curve:
Bear in mind that you are able to navigate over the integrals by using the 'Previous or Next' icons. You can delete an integral one by one by clicking on the 'Delete' button.
If you want to normalize the integrals, just overwrite the desired value on the 'Normalized box' and press OK, all integrals will update with reference to the chosen one.
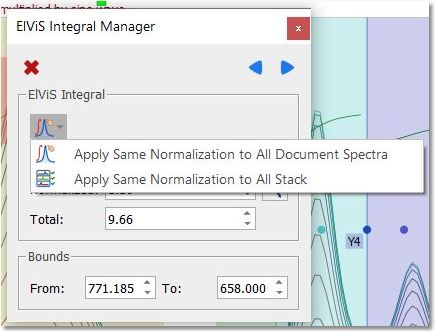
You can apply the same integral normalization to all the spectra (in the current document) or to all the traces of a stack plot by selecting the applicable option, as you can see below.
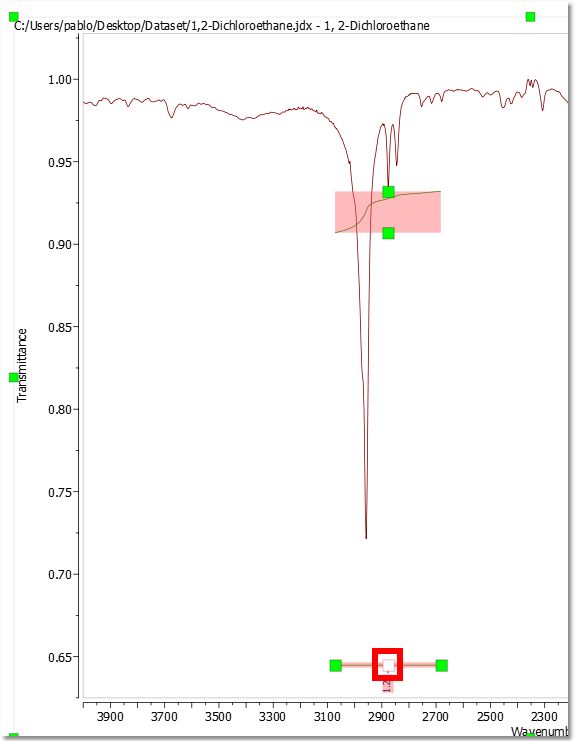
Integral regions can be split by clicking (or clicking and dragging) on the 'red square' of the integral segment:
All the integrals will be stored in the integrals table which can be displayed by clicking on the applicable button of the ribbon (or by following the menu 'View/Tables/ElViS/ElViS Integrals'):
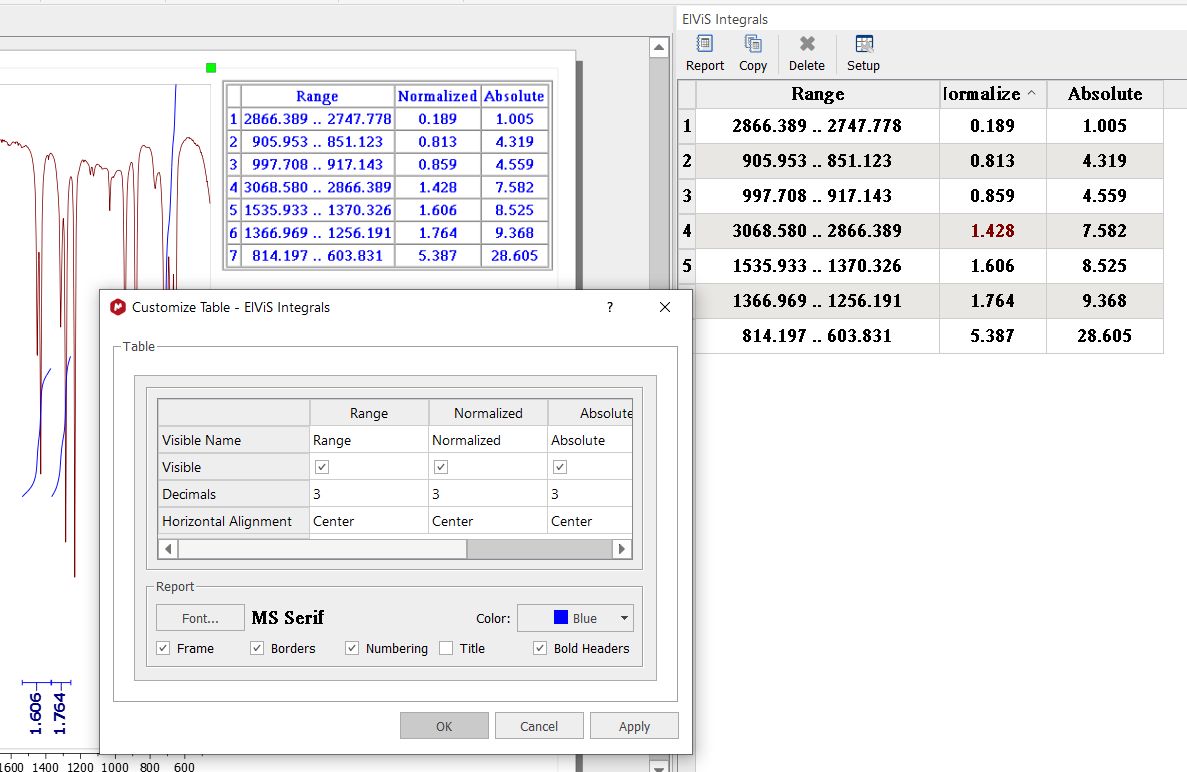
The information displayed in the table can be customized by clicking on the 'Setup' button. As usual, you can report and copy to clipboard the table:
|